Fortgeschrittene Umkehrstrategie basierend auf RSI und Volumen im quantitativen Handel

Überblick
Es handelt sich um eine Umkehrhandelsstrategie, die auf dem RSI-Indikator und dem Transaktionsvolumen basiert. Die Strategie wird durch die Identifizierung von Überkauf-Überverkaufszuständen in den Märkten kombiniert mit Transaktionsbestätigung, um bei extremen Preiszuständen umgekehrt zu handeln. Die Kernidee der Strategie besteht darin, bei Überkauf- oder Überverkaufssignalen des RSI-Indikators und überdurchschnittlichem Transaktionsvolumen zu handeln.
Strategieprinzip
Die Strategie basiert auf folgenden Kernkomponenten:
- Berechnung des RSI: Der RSI über 14 Zyklen wird verwendet, um die Preisentwicklung zu beobachten
- Bestätigung der Transaktionsmenge: Die Transaktionsmenge wird mit einem Moving Average (SMA) über 20 Perioden ermittelt.
- Eingangslogik:
- Mehrere Eintritte: Wenn der RSI unter 30 liegt (überverkauf) und der Umsatz größer ist als der Moving Average
- Eintritt mit leerem Kopf: Wenn der RSI über 70 liegt (überkauft) und die Transaktionen größer sind als der Moving Average
- Die Ausgangslogik:
- Mehrköpfige Auftritte: 50 auf RSI
- Blankenspiel: 50 unter dem RSI
Strategische Vorteile
- Systematisierte Handelsentscheidungen: Einrichtung eines objektiven Handelssystems durch eine klare Kombination von technischen Kennzahlen
- Mehrere Bestätigungsmechanismen: Verbesserte Signalzuverlässigkeit in Kombination mit zwei Dimensionen RSI und Transaktionsvolumen
- Gute Risikokontrolle: Verwenden Sie die Vermögensverwaltung in Prozent und verbieten Sie den Wiederaufbau von Lagerstätten
- Visualisierungsunterstützung: enthält vollständige Diagrammdarstellungen zur einfachen Analyse und Überwachung
- Anpassungsfähigkeit: Die wichtigsten Parameter können individuell angepasst werden, um sich an unterschiedliche Marktbedingungen anzupassen
Strategisches Risiko
- Trend-Rückhalte-Risiken: In stark trendigen Märkten kann eine Umkehrstrategie häufig zu Verlusten führen
- Falsche Durchbruchrisiken: Hohe Transaktionszahlen bedeuten nicht unbedingt eine echte Marktwende
- Parameter-Sensitivität: RSI-Zyklen und die Wahl von Überkauf-Überverkauf-Schwellenwerten haben einen signifikanten Einfluss auf die Strategie
- Schlupfpunkt-Effekte: In Zeiten starker Schwankungen können die Transaktionspreise deutlich von den Erwartungen abweichen
- Kapitalmanagementrisiken: Fixed-Ratio-Positionen können unter bestimmten Marktbedingungen zu radikal sein
Richtung der Strategieoptimierung
- Trendfilter: Einführung von Trend-Anzeigen, um Rückschläge während starker Trends zu vermeiden
- Dynamische Parameter: Überkauf-Überverkauf-Schwellenwert des RSI, der dynamisch auf Marktfluktuationen angepasst wird
- Optimierung der Ausgangsposition: Erhöhung der Stop-Loss- und Tracking-Stopp-Mechanismen und Verbesserung der Risikokontrolle
- Erweiterte Transaktionsanalyse: Hinzu kommt die Transaktionsformalanalyse, um die Signalqualität zu verbessern
- Zeitfilter: Hinzufügen von Zeitfenstern für den Handel, um ineffiziente Zeiten zu vermeiden
Zusammenfassen
Die Strategie ist durch die Kombination von RSI-Indikatoren und Transaktionsvolumenanalyse zu einem vollständigen Reverse-Trading-System aufgebaut. Die Strategie ist vernünftig ausgelegt, hat eine gute Bedienbarkeit und Flexibilität. Durch die empfohlene Optimierungsrichtung gibt es noch Raum für weitere Steigerung der Strategie.
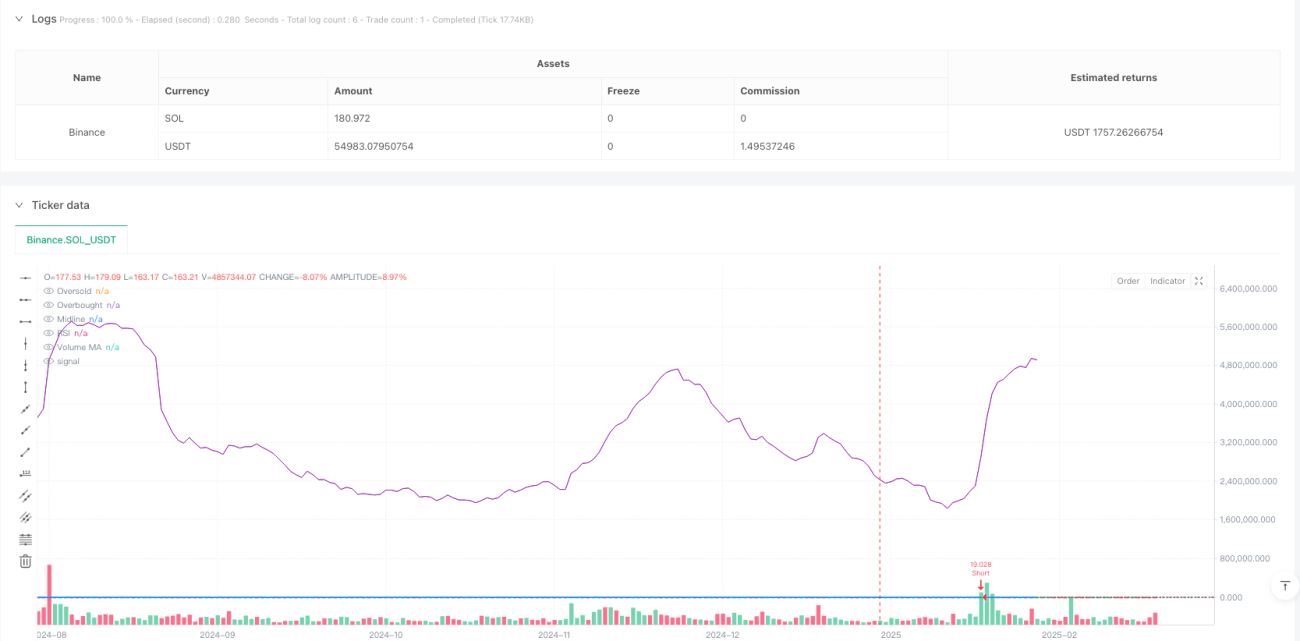
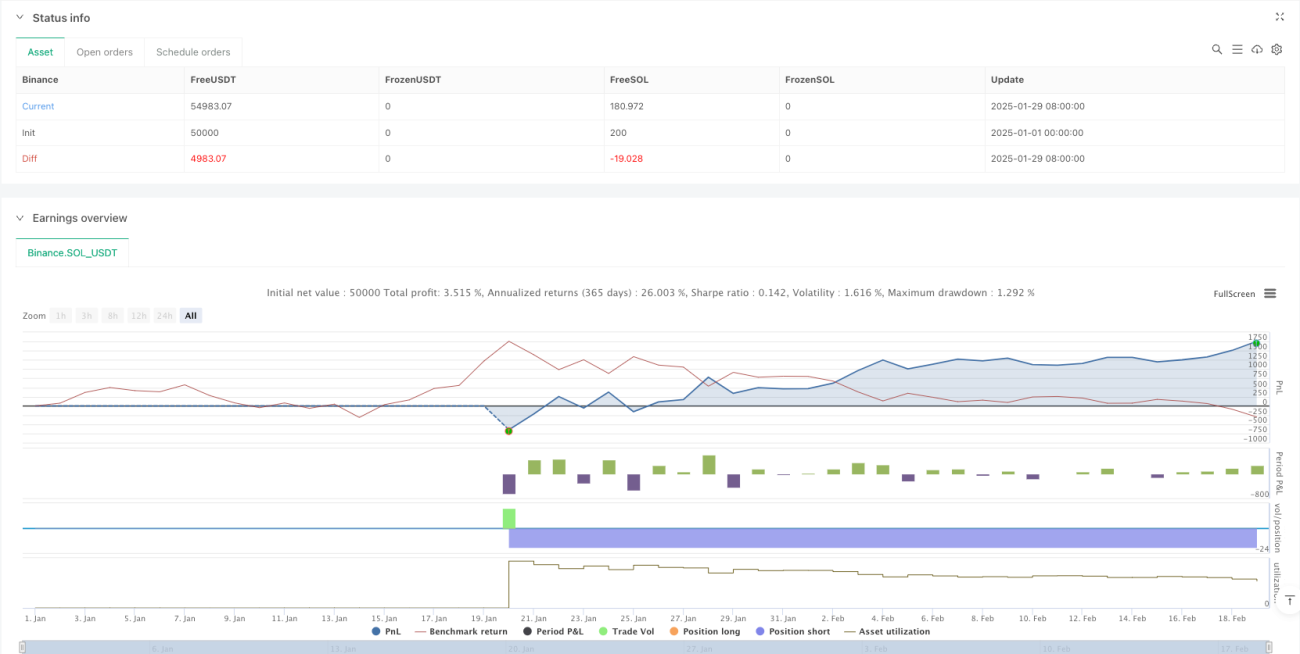
/*backtest
start: 2025-01-01 00:00:00
end: 2025-02-19 08:00:00
period: 1d
basePeriod: 1d
exchanges: [{"eid":"Binance","currency":"SOL_USDT"}]
*/

//@version=5
strategy("RSI & Volume Contrarian Strategy", overlay=true, initial_capital=100000, default_qty_type=strategy.percent_of_equity, default_qty_value=10, pyramiding=0)

//---------------------------- 1