
Überblick
Die Strategie ist ein intelligentes Handelssystem, das auf mehreren technischen Indikatoren basiert und die drei wichtigsten technischen Indikatoren Bollinger Bands, Stochastic Oscillator und Average True Rate (ATR) kombiniert, um potenzielle Handelsmöglichkeiten durch eine umfassende Analyse der Marktvolatilität, -dynamik und -trends zu identifizieren. Die Strategie verwendet eine dynamische Stop-Loss- und Profit-Zielsetzung, die die Handelsparameter automatisch an die Marktfluktuation anpasst.
Strategieprinzip
Die Kernlogik der Strategie basiert auf einer Dreifach-Verifizierung:
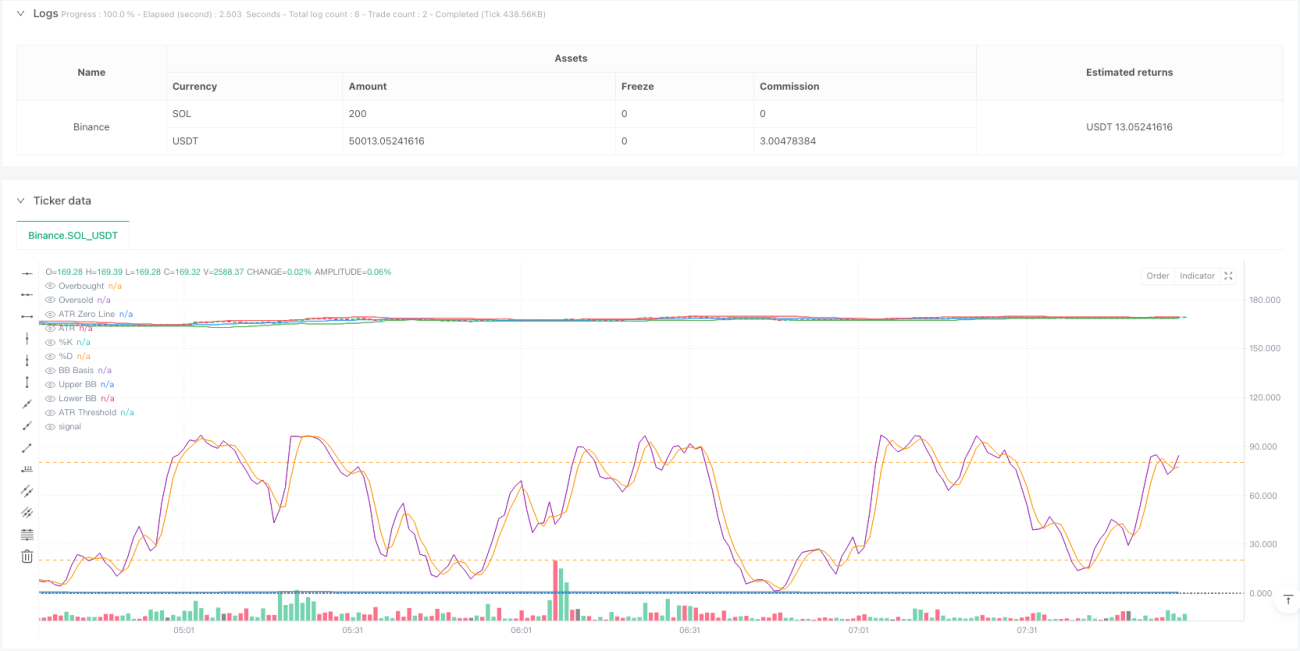
- Definition von Preisschwankungsbereichen mit Brin-Bändern, um Übersell-Opportunitäten zu erkennen, wenn der Preis die Brin-Band unterbricht, und Überkauf-Opportunitäten, wenn er die Brin-Band überbricht
- Durch Zufallsindikatoren in den Überkaufzonen ((> 80) und Überverkaufzonen ((< 20) wird die Dynamik bestätigt, wobei die Kreuzung der %K- und %D-Linien als Einstiegssignal dient
- Einführung des ATR-Index als Volatilitätsfilter, um sicherzustellen, dass der Handel mit ausreichender Unterstützung durch Marktvolatilität erfolgt
Die Erzeugung eines Handelssignals erfordert folgende Bedingungen:
Kaufbedingungen:
- Der Preis schloss unterhalb der Brin-Regel.
- Zufälliger Indikator %K-Linie über %D-Linie nach oben in der Überverkaufszone
- ATR-Werte höher als der eingestellte Schwellenwert, um ausreichende Marktvolatilität zu bestätigen
Verkaufsbedingungen:
- Der Preis schloss über der Brin-Band-Strecke.
- Randomisierte %K-Linie durchquert die %D-Linie nach unten in der Überkaufzone
- ATR-Werte bleiben über der Schwelle und bestätigen die Gültigkeit der Transaktion
Strategische Vorteile
- Multiple-Technik-Indikator-Kreuzprüfung, die die Zuverlässigkeit von Handelssignalen erheblich erhöht
- Dynamische Stop-Loss- und Gewinnziel-Einstellungen, die die Risikomanagement-Parameter automatisch an die Marktvolatilität anpassen
- Die Fluktuationsfiltermechanismen wirksam verhindern falsche Signale während der niedrigen Schwankungen
- Indikatorparameter können flexibel an unterschiedliche Marktbedingungen angepasst werden und haben eine gute Anpassungsfähigkeit
- Die Strategie ist klar, einfach zu verstehen und zu implementieren und ist für Händler auf allen Ebenen geeignet
Strategisches Risiko
- Ein Ausrutscher kann bei starken Marktschwankungen auftreten und den tatsächlichen Ausführungspreis beeinflussen.
- Die Verwendung von mehreren Kennzahlen kann zu Signalverzögerungen führen und die beste Einstiegszeit verpassen.
- Überoptimierung der Parameter kann zu einer Überpassung führen, die die Performance der Strategie in der Realität beeinträchtigt
- Bei Trendwendepunkten können falsche Signale auftreten, die mit anderen Analysetools kombiniert werden müssen.
- Handelskosten und Provisionen können die Gesamtergebnisleistung der Strategie beeinflussen
Richtung der Strategieoptimierung
- Einführung von Trendfiltern, wie beispielsweise Moving Average Crossing Systems, um die Trendbestätigung zu verbessern
- Optimierung der dynamischen Anpassungsmechanismen der ATR-Temperature, um sie besser an unterschiedliche Marktbedingungen anzupassen
- Erhöhung der Validierung von Transaktionsvolumenindikatoren und der Zuverlässigkeit von Handelssignalen
- Optimierung der Anpassungsparameter, automatische Anpassung der Indikatorparameter an die Marktlage
- Hinzufügen von Zeitfiltern, um den Handel während der größten Marktschwankungen zu vermeiden
Zusammenfassen
Die Strategie baut durch die Kombination von Brinband, Random Indicator und ATR ein vollständiges Handelssystem auf. Die Vorteile der Strategie liegen in der Überprüfung mehrerer Indikatoren und dem dynamischen Risikomanagement, wobei jedoch auch auf die Optimierung der Parameter und die Anpassungsfähigkeit der Marktumgebung geachtet werden muss. Durch kontinuierliche Optimierung und Verbesserung wird die Strategie eine stabile Ertragsleistung im tatsächlichen Handel erwarten.
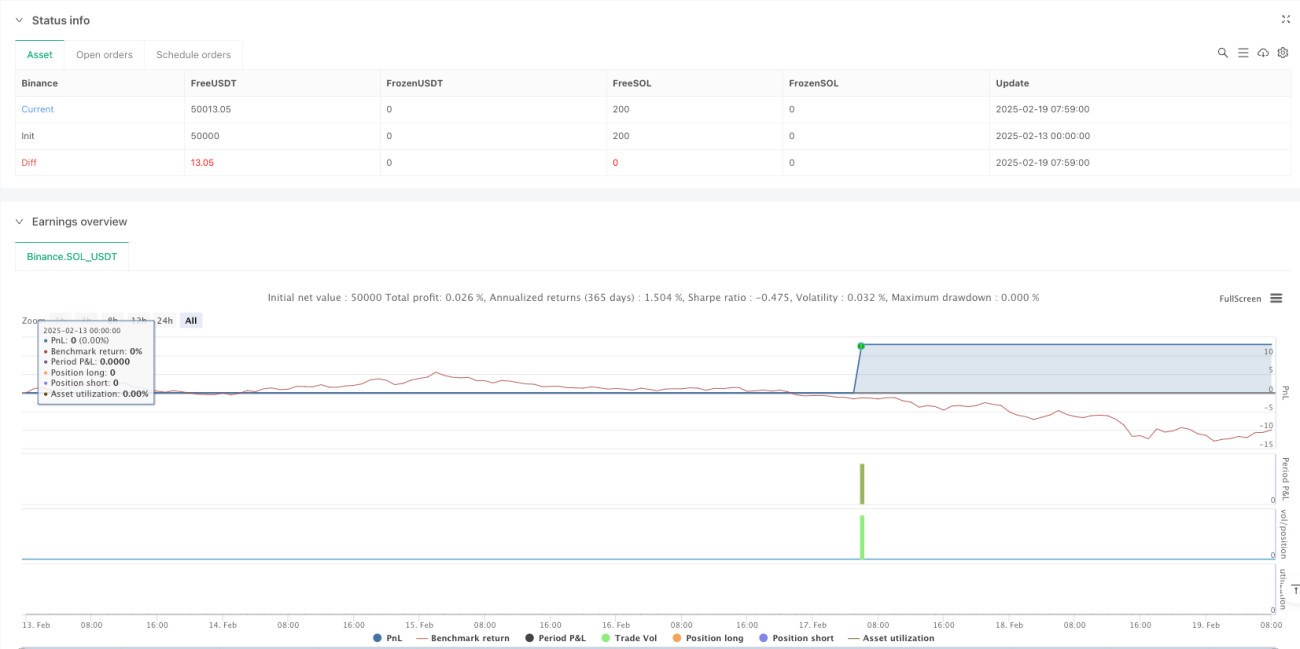
/*backtest
start: 2025-02-13 00:00:00
end: 2025-02-19 08:00:00
period: 1m
basePeriod: 1m
exchanges: [{"eid":"Binance","currency":"SOL_USDT"}]
*/

//@version=5
strategy("Bollinger Bands + Stochastic Oscillator + ATR Strategy", overlay=true, default_qty_type=strategy.percent_of_equity, default_qty_value=10)

// Bollinger Bands Parameters- 1