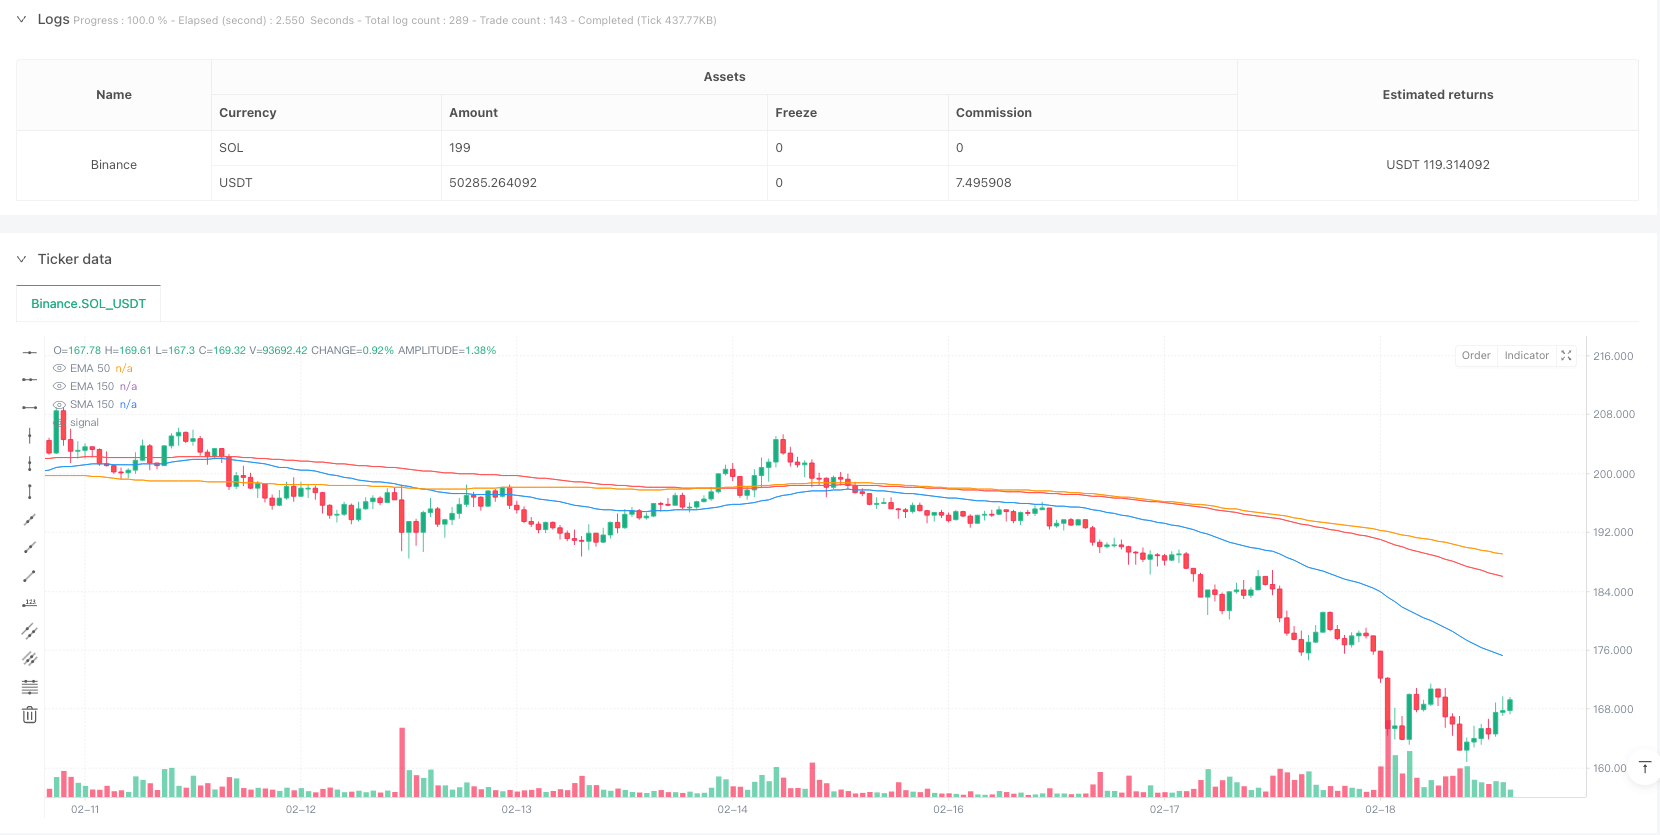
Überblick
Die Strategie ist ein Trend-Tracking-Trading-System, das eine Kombination aus Index-Moving Averages (EMA) und einfachen Moving Averages (SMA) enthält. Die Strategie nutzt hauptsächlich die Kreuzung von EMA50 und EMA150, um Handelssignale zu erzeugen, und verwendet SMA150 als Stop-Line und enthält einen Wiedereintrittsmechanismus nach dem Stopp. Diese Design kann sowohl mittelfristige Trends erfassen als auch das Risiko effektiv kontrollieren.
Strategieprinzip
Die Kernlogik der Strategie umfasst die folgenden Schlüsselelemente:
- Eintrittssignal: Wenn EMA50 nach oben durch EMA150 fährt, erzeugt es ein Mehrfachsignal; wenn EMA50 nach unten durch EMA150 fährt, erzeugt es ein Hohlsignal.
- Stop-Loss-Mechanismus: Der Stop-Loss wird ausgelöst, wenn der Preis unter SMA 150 fällt.
- Ein Wiedereintrittsmechanismus: Wenn der Preis die EMA150 erneut überschreitet, wird nach dem Auslösen des Stop-Losses ein Wiedereintritt durchgeführt. Wenn die EMA50 erneut die EMA150 überschreitet, wird der Eintritt gelöscht.
- Handelsabwicklung: Die Strategie führt die Geschäfte innerhalb des angegebenen Zeitrahmens aus und berücksichtigt eine Provision von 0,1% und einen Gleitpunkt von 3 Punkten.
Strategische Vorteile
- Trend-Tracking-Fähigkeit: Durch die Verwendung von Mittellinienkombinationen für verschiedene Perioden ist es möglich, Markttrends effektiv zu erfassen.
- Risikokontrolle: Es wurden eindeutige Stop-Loss-Bedingungen festgelegt, um zu hohe Verluste zu vermeiden.
- Der Wiedereintrittsmechanismus ist flexibel: Er erlaubt den Wiedereintritt bei verbesserten Marktbedingungen und erhöht die Gewinnchancen.
- Die Parameter sind vernünftig eingestellt: Die Zykluswahl von EMA50 und EMA150 balanciert zwischen Empfindlichkeit und Stabilität.
- Berücksichtigen Sie die tatsächlichen Transaktionskosten: Kommissions- und Slippage-Faktoren sind enthalten, um dem tatsächlichen Umfeld näher zu kommen.
Strategisches Risiko
- Schwankungsrisiken: Bei schwankenden Märkten kann es zu häufigen falschen Durchbruchsignalen kommen.
- Rückstandsrisiko: Der Moving Average ist selbst rückständig und kann die beste Einstiegsmomente verpassen.
- Risiko eines Wiedereintritts: In stark schwankenden Märkten kann ein Wiedereintrittsmechanismus zu einem kontinuierlichen Stop-Loss führen.
- Risikomanagement: Die Strategie beinhaltet keine spezifischen Positionsmanagementprogramme.
- Marktumfeldabhängigkeit: Die Strategie kann in verschiedenen Marktzyklen stark variieren.
Richtung der Strategieoptimierung
- Einführung von Volatilitätsindikatoren: ATRs oder Bollinger Bands können hinzugefügt werden, um die Stop-Position anzupassen, um die Stop-Losses anpassungsfähiger zu machen.
- Positionsverwaltung verbessern: Die Einführung eines dynamischen Positionsverwaltungssystems auf Basis von Volatilität wird empfohlen.
- Optimierung der Wiedereintrittsbedingungen: Die Genauigkeit des Wiedereintrittssignals kann in Kombination mit Schwankungsindikatoren wie dem RSI verbessert werden.
- Erhöhung der Marktumgebungsfilterung: Hinzufügen von Trendstärken und Reduzierung der Handelsfrequenz in den weniger tendenziösen Märkten.
- Entwicklung von Anpassungsparametern, die den Durchschnittszyklus dynamisch an Marktschwankungen anpassen können.
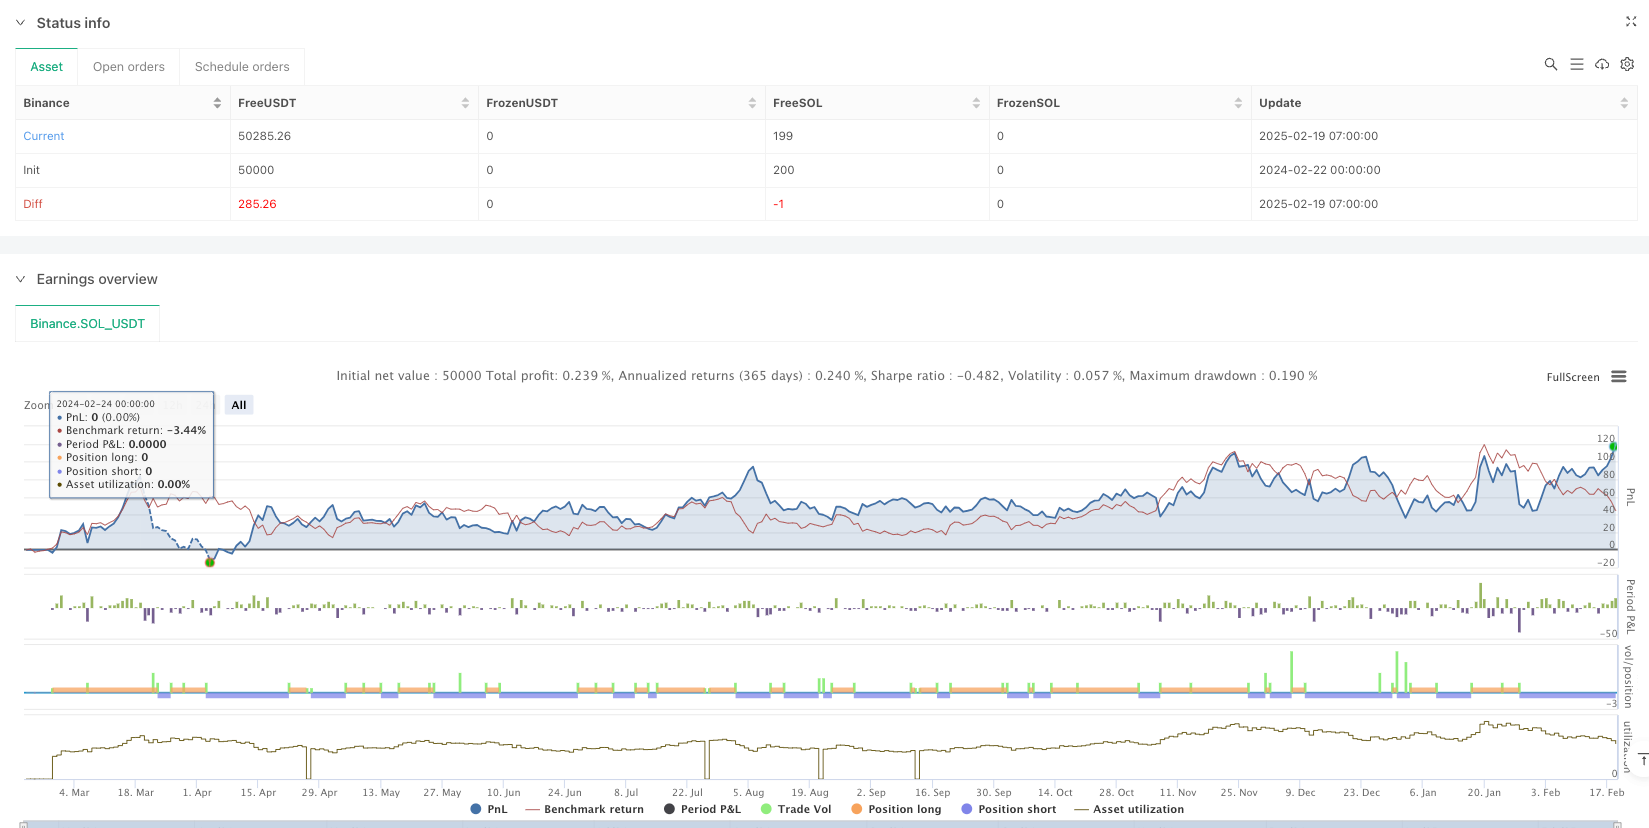
Zusammenfassen
Es handelt sich um eine vernünftige Trendverfolgungsstrategie, die die Trends durch eine lineare Kreuzung erfasst und mit einem ausgefeilten Risikokontrollmechanismus ausgestattet ist. Die Hauptvorteile der Strategie liegen in der Trendspeicherkapazität des Systems und der Risikomanagement-Design, aber in der praktischen Anwendung muss auf die Auswirkungen der Marktumgebung auf die Strategie-Performance geachtet werden.
/*backtest
start: 2024-02-22 00:00:00
end: 2025-02-19 08:00:00
period: 1h
basePeriod: 1h
exchanges: [{"eid":"Binance","currency":"SOL_USDT"}]
*/

//@version=6
strategy("EMA 50 and EMA 150 with SMA150 Stop-loss and Re-Entry #ganges", overlay=true, commission_type=strategy.commission.percent, commission_value=0.1, slippage=3)


// EMA and SMA Calculations
ema50 = ta.ema(close, 50)
ema150 = ta.ema(close, 150)
sma150 = ta.sma(close, 150)

// Conditions for Buy, Sell, and Stop-Loss
ema50CrossAboveEMA150 = ta.crossover(ema50, ema150)  // Buy signal
ema50CrossBelowEMA150 = ta.crossunder(ema50, ema150) // Sell signal
priceCrossAboveEMA150 = ta.crossover(close, ema150) // Price crosses EMA 150 from below
priceCloseBelowSMA150 = close < sma150              // Stop-loss for long positions


// Track stop-loss hit state
var bool stopLossHit = false

// Strategy Logic
// Buy Logic: EMA 50 crosses EMA 150 from below
if ema50CrossAboveEMA150
    strategy.entry("Buy Signal", strategy.long, qty=1)
    stopLossHit := false // Reset stop-loss state when a new buy position is opened

// Sell Logic: EMA 50 crosses EMA 150 from above
if ema50CrossBelowEMA150
    strategy.entry("Sell Signal", strategy.short, qty=1)
    stopLossHit := false // Reset stop-loss state when a new sell position is opened

// Stop-Loss for Long Positions: Close if price falls below SMA 150
if strategy.position_size > 0 and priceCloseBelowSMA150
    strategy.close("Buy Signal")
    stopLossHit := true // Mark stop-loss hit

// Re-Entry Logic After Stop-Loss
if stopLossHit
    if priceCrossAboveEMA150 // Re-buy logic: PRICE crosses EMA 150 from below
        strategy.entry("Re-Buy Signal", strategy.long, qty=1)
        stopLossHit := false // Reset stop-loss state after re-entry
    if ema50CrossBelowEMA150 // Re-sell logic: EMA 50 crosses EMA 150 from above
        strategy.entry("Re-Sell Signal", strategy.short, qty=1)
        stopLossHit := false // Reset stop-loss state after re-entry

// Plot EMA and SMA Lines
plot(ema50, color=color.blue, title="EMA 50")
plot(ema150, color=color.red, title="EMA 150")
plot(sma150, color=color.orange, title="SMA 150")


// // Calculate Recent All-Time High
// highestHigh = ta.highest(high, 500) // Lookback period of 500 bars
// percentageFall = ((highestHigh - close) / highestHigh) * 100

// // Display Percentage Fall on the Most Recent Candle Only
// isLastBar = bar_index == ta.max(bar_index)
// if isLastBar
//     labelText = str.tostring(percentageFall, "#.##") + "% Fall from ATH"
//     labelPosition = high + ta.atr(14) * 2 // Positioning label above the candle
//     label.new(bar_index, labelPosition, labelText, color=color.red, textcolor=color.white, size=size.small, style=label.style_label_down)