Überblick
Die Strategie ist ein Handelssystem, das eine Kombination aus einer doppelten Mittellinien-Kreuzung und einem relativ schwachen Indikator ((RSI)) verwendet. Die Strategie verwendet einen 9-Perioden- und 21-Perioden-Index-Moving-Average (EMA) als Hauptsignalgenerierungstool, während der RSI-Indikator als Filter eingeführt wird, um zu vermeiden, dass in übertriebenen Kauf-/Verkaufszonen gehandelt wird. Diese Kombinationsmethode behält sowohl die Eigenschaften des Trend-Trackings als auch die Dimension der Dynamikbestätigung.
Strategieprinzip
Die Kernlogik der Strategie basiert auf den folgenden Schlüsselkomponenten:
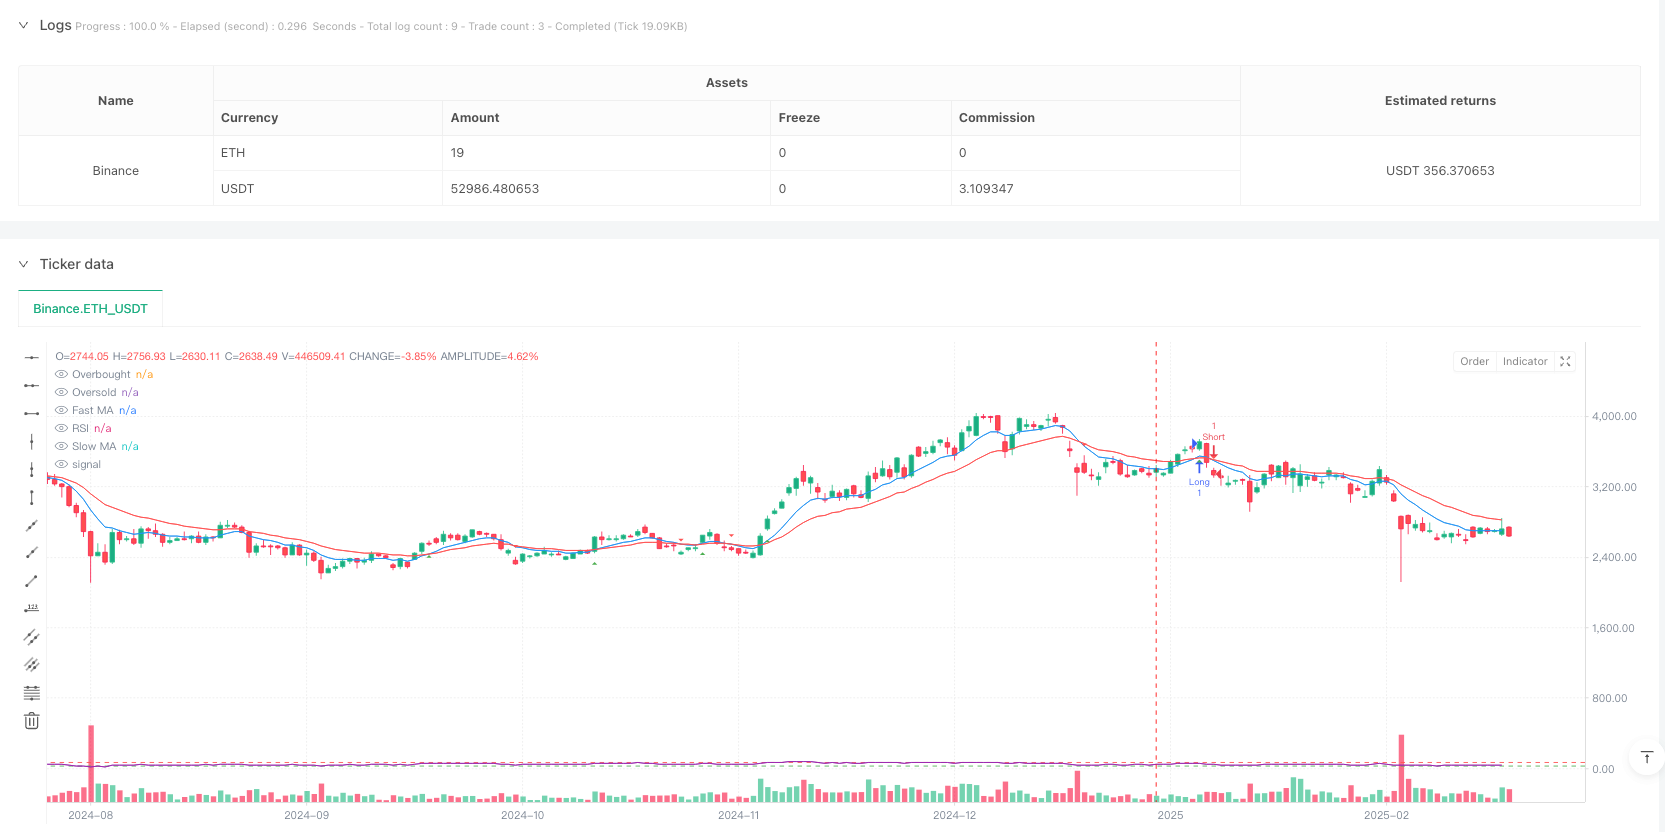
- Kreuzung von schnellen EMAs (mit 9 Zyklen) und langsamen EMAs (mit 21 Zyklen)
- Der RSI-Indikator ((14-Zyklen) dient als Filter, wobei 70 und 30 als Überkauf- und Überverkauf-Schwellenwerte festgelegt werden
- Kaufbedingungen: schnelle EMA über schlechte EMA und RSI unter 70
- Verkaufsbedingungen: Schnelle EMA unter Durchschnittsschwelle mit RSI über 30 Eine Strategie, die auf diese Weise die Zuverlässigkeit von Trendsignalen gewährleistet und den Handel in einer überhitzten oder überkühlten Zeit vermeidet.
Strategische Vorteile
- Signalzuverlässigkeit: Erhöht die Zuverlässigkeit von Handelssignalen durch die Kombination von Trend- und Dynamikindikatoren
- Risikokontrolle: Der RSI-Filter verhindert den Handel in übertriebenen Kauf-/Verkaufszonen
- Anpassungsfähigkeit: Strategieparameter können an unterschiedliche Marktbedingungen angepasst werden
- Hohe Automatisierungsstufe: enthält vollständige Signalgeneration und Erinnerung
- Gute Visualisierung: Eine klare Grafik-Oberfläche, die es den Händlern erleichtert, den Markt zu verstehen
Strategisches Risiko
- Rückstandsrisiko: Der Moving Average ist im Wesentlichen ein rückständiger Indikator, der in schnell schwankenden Märkten zu Verzögerungen führen kann
- Falsche Durchbruchgefahr: Häufige falsche Durchbruchsignale in OTC-Märkten
- Parameter-Sensitivität: Strategieeffekte sind empfindlich auf Parameter-Einstellungen, unterschiedliche Kombinationen von Parametern können in verschiedenen Marktumgebungen erforderlich sein
- Abhängigkeit von Marktbedingungen: bessere Leistung in trendigen Märkten, möglicherweise schlechtere in turbulenten Märkten
Richtung der Strategieoptimierung
- Einführung von Volatilitätsindikatoren: Erwägen Sie, ATRs oder Bollinger Bands hinzuzufügen, um sich an unterschiedliche Marktschwankungen anzupassen
- Optimierte Signalfilterung: Ein Umsatzindex kann als zusätzliche Bestätigung in Betracht gezogen werden
- Dynamische Parameteranpassung: Entwicklung eines anpassungsfähigen Parametersystems, das die Indikatorparameter automatisch an die Marktlage anpasst
- Erhöhung der Stop-Loss-Funktion: Erhöhung der Dynamischen Stop-Loss-Funktion und der Risikomanagement-Fähigkeit
- Optimierung des Zeitrahmens: Berücksichtigung der Analyse mehrerer Zeitrahmen zur Verbesserung der Signalsicherheit
Zusammenfassen
Die Strategie erstellt ein relativ vollständiges Handelssystem durch die Kombination klassischer technischer Analyse-Tools. Durch die gleichmäßige Kreuzung von Trends, Signalfilterung mit dem RSI und die organische Kombination von Trendverfolgung und Dynamikbestätigung. Die Hauptvorteile der Strategie liegen in ihrer Zuverlässigkeit und Risikokontrolle, aber auch in der Rückständigkeit der Moving Averages und der Empfindlichkeit der Parameter-Einstellungen.
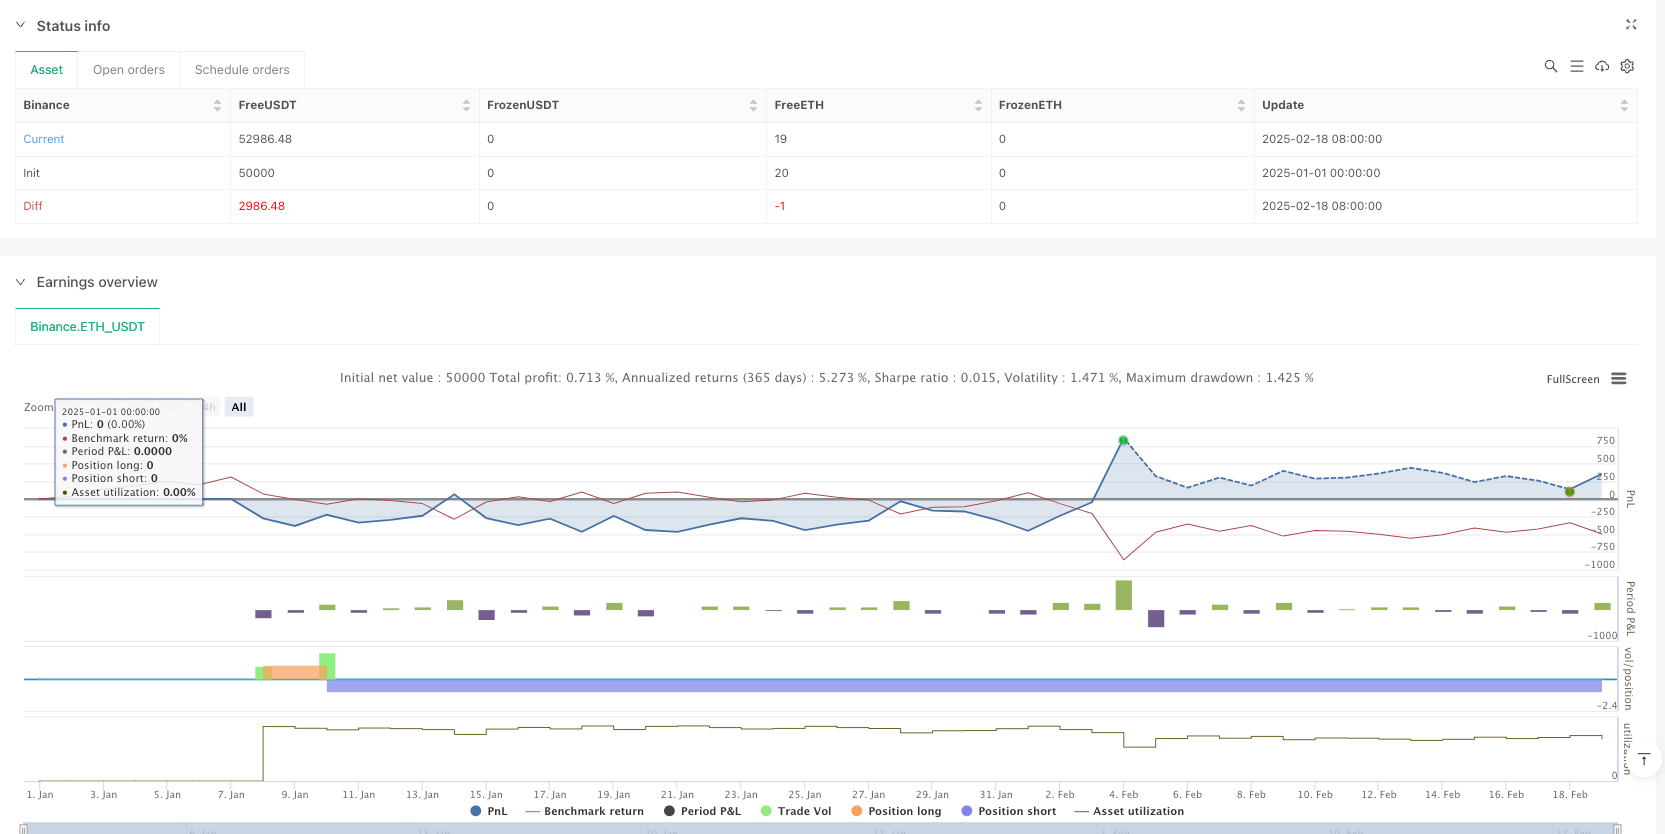
/*backtest
start: 2025-01-01 00:00:00
end: 2025-02-19 08:00:00
period: 1d
basePeriod: 1d
exchanges: [{"eid":"Binance","currency":"ETH_USDT"}]
*/

// This Pine Script™ code is subject to the terms of the Mozilla Public License 2.0 at https://mozilla.org/MPL/2.0/
// © McTunT

// Gold Price Trading Signals
// Pine Script version 6 code for TradingView
//@version=6
strategy("Ausiris Gold Trading Strategy", overlay=true)

// Input parameters
fastLength = input.int(9, title="Fast MA Length", minval=1)
slowLength = input.int(21, title="Slow MA Length", minval=1)
rsiLength = input.int(14, title="RSI Length", minval=1)
rsiOverbought = input.int(70, title="RSI Overbought Level", minval=50, maxval=100)
rsiOversold = input.int(30, title="RSI Oversold Level", minval=0, maxval=50)

// Calculate moving averages
fastMA = ta.ema(close, fastLength)
slowMA = ta.ema(close, slowLength)

// Calculate RSI
rsiValue = ta.rsi(close, rsiLength)

// Plot moving averages
plot(fastMA, color=color.blue, title="Fast MA")
plot(slowMA, color=color.red, title="Slow MA")

// Generate signals
longCondition = ta.crossover(fastMA, slowMA) and rsiValue < rsiOverbought
shortCondition = ta.crossunder(fastMA, slowMA) and rsiValue > rsiOversold

// Plot buy/sell signals
plotshape(longCondition, title="Buy Signal", location=location.belowbar, color=color.green, style=shape.triangleup, size=size.small)
plotshape(shortCondition, title="Sell Signal", location=location.abovebar, color=color.red, style=shape.triangledown, size=size.small)

// Strategy entry/exit
if (longCondition)
    strategy.entry("Long", strategy.long)
if (shortCondition)
    strategy.entry("Short", strategy.short)

// Add alert conditions
alertcondition(longCondition, title="Buy Alert", message="Gold Buy Signal!")
alertcondition(shortCondition, title="Sell Alert", message="Gold Sell Signal!")

// Display RSI values
hline(rsiOverbought, "Overbought", color=color.red)
hline(rsiOversold, "Oversold", color=color.green)
plot(rsiValue, "RSI", color=color.purple, display=display.none)