2
konzentrieren Sie sich auf
451
Anhänger
Überblick
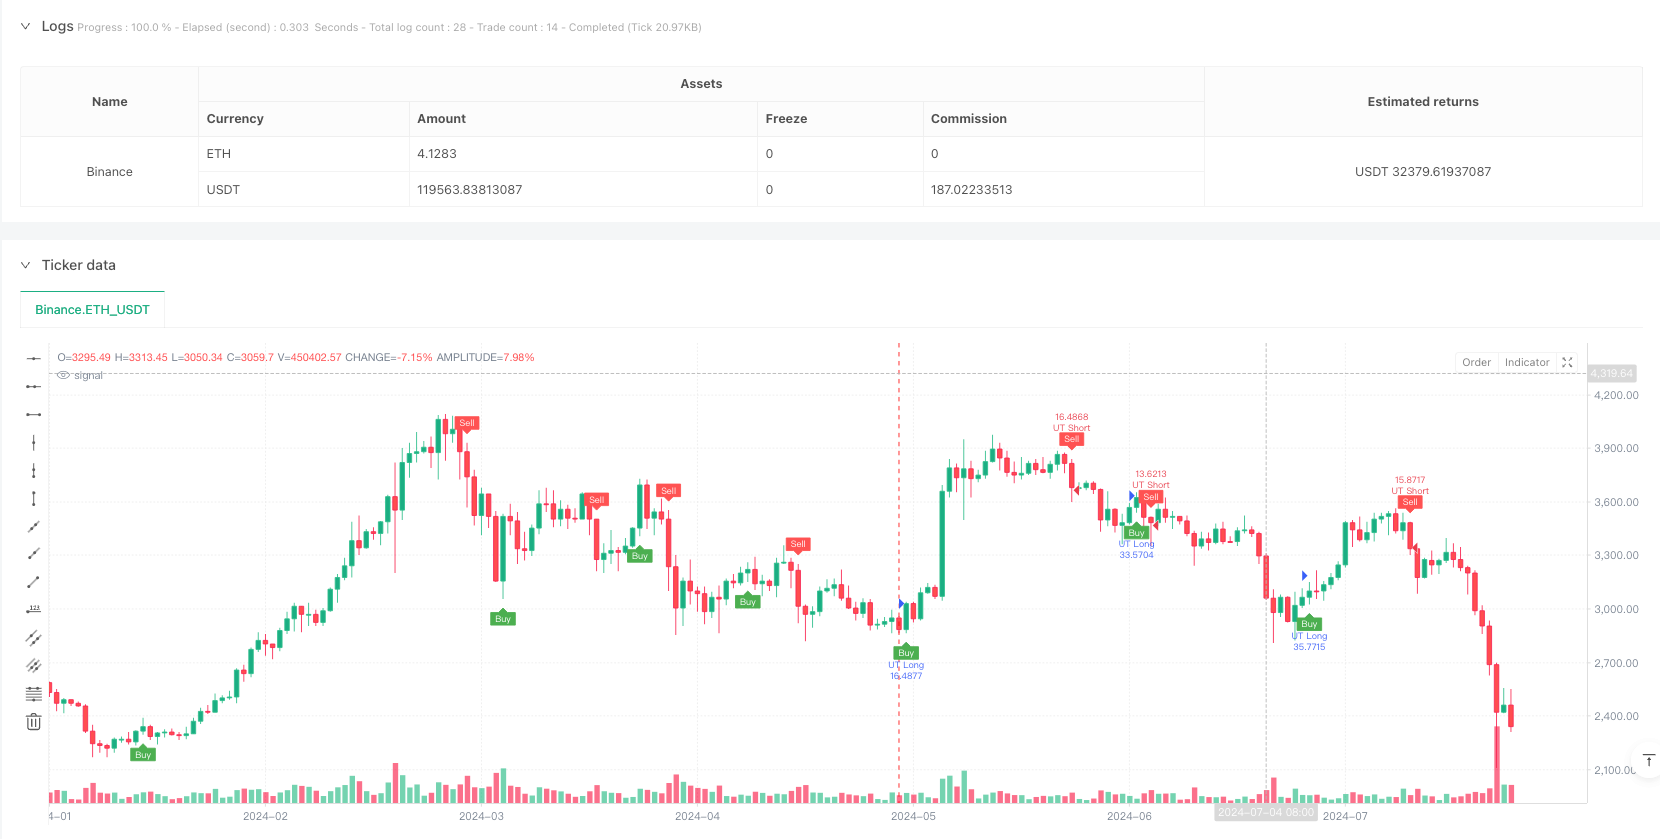
Dies ist eine Trend-Tracking-Strategie basierend auf dem ATR (Average True Range) Indikator, kombiniert mit einem dynamischen Stop-Loss und einem Mittellinien-Kreuzsignal. Die Strategie ermittelt die Marktvolatilität durch die Berechnung des ATR und nutzt diese Information, um einen dynamischen Tracking-Stop-Loss-Line zu erstellen.
Strategieprinzip
Die Kernlogik der Strategie basiert auf folgenden Schlüsselberechnungen:
- Der ATR-Indikator wird verwendet, um die Volatilität des Marktes zu messen.
- Dynamische Stoppdistanz berechnet auf Basis von ATR-Werten, angepasst an die Sensitivitätsparameter a
- Aufbau einer Stop-Line für ATR-Tracking, die sich dynamisch an den Kursbewegungen anpasst
- Die Kreuzung der Stop-Line mit dem 1-Zyklus-EMA und dem ATR wird verwendet, um ein Handelssignal zu ermitteln
- Wenn die EMA die ATR-Tracking-Stop-Line nach oben durchbricht, öffnet sie sich und wenn sie nach unten durchbricht, öffnet sie sich
- Optional HLC3-Preise mit normalen Schließungspreisen oder Ping-Pong-K-Linien als Berechnungsgrundlage
Strategische Vorteile
- Dynamische Anpassungsfähigkeit: ATR-Tracking-Stopps können sich automatisch an die Marktvolatilität anpassen, so dass die Strategie in verschiedenen Marktumgebungen stabil bleibt
- Perfekte Risikokontrolle: Dauerhafter Schutz der Position durch eine dynamische Stop-Line
- Die Parameter sind flexibel: Sie können unterschiedliche Markteigenschaften anpassen, indem Sie ATR-Zyklen und -Sensitivität anpassen
- Signal eindeutig und zuverlässig: Kombination mit Gleichlinienkreuzung bietet klare Ein- und Ausstiegssignale
- Die Berechnungslogik ist einfach: Die Strategielogik ist klar, leicht zu verstehen und zu pflegen.
- Gute Visualisierung: Graphische Darstellung von Handelssignalen und Trends
Strategisches Risiko
- Schwankungsrisiko: Häufige falsche Durchbruchsignale in schwankenden Märkten
- Schlupfpunkt-Effekte: Bei schnellen Geschwindigkeiten können größere Schlupfpunkte auftreten, die die Strategie beeinflussen
- Parametersensitivität: Unterschiedliche Parameterkombinationen können zu großen Unterschieden in der Strategieleistung führen
- Trendabhängigkeit: Die Strategie kann in Märkten ohne Trends möglicherweise nicht erfolgreich sein.
- Stop-Loss-Grad: Ausnahmen bei ATR-Werten können zu unzumutbaren Stop-Loss-Positionen führen
Richtung der Strategieoptimierung
- Erhöhung der Trendfilter: Einführung zusätzlicher Trendbeurteilungsindikatoren zur Verringerung der Falschsignale bei Marktschwankungen
- Optimierungsparameter-Adaption: Entwicklung eines Mechanismus zur automatischen Optimierung von ATR-Zyklen und -Sensitivität
- Verbesserte Signalbestätigung: Erhöhung des Transaktionsvolumens oder anderer technischer Indikatoren als Signalbestätigung
- Verbesserte Stop-Loss-Mechanismen: Erhöhung der Kombination aus festen und mobilen Stop-Losses auf der Grundlage von ATR
- Erhöhung der Positionsverwaltung: Anpassung der Positionsgröße an die dynamischen Marktschwankungen
Zusammenfassen
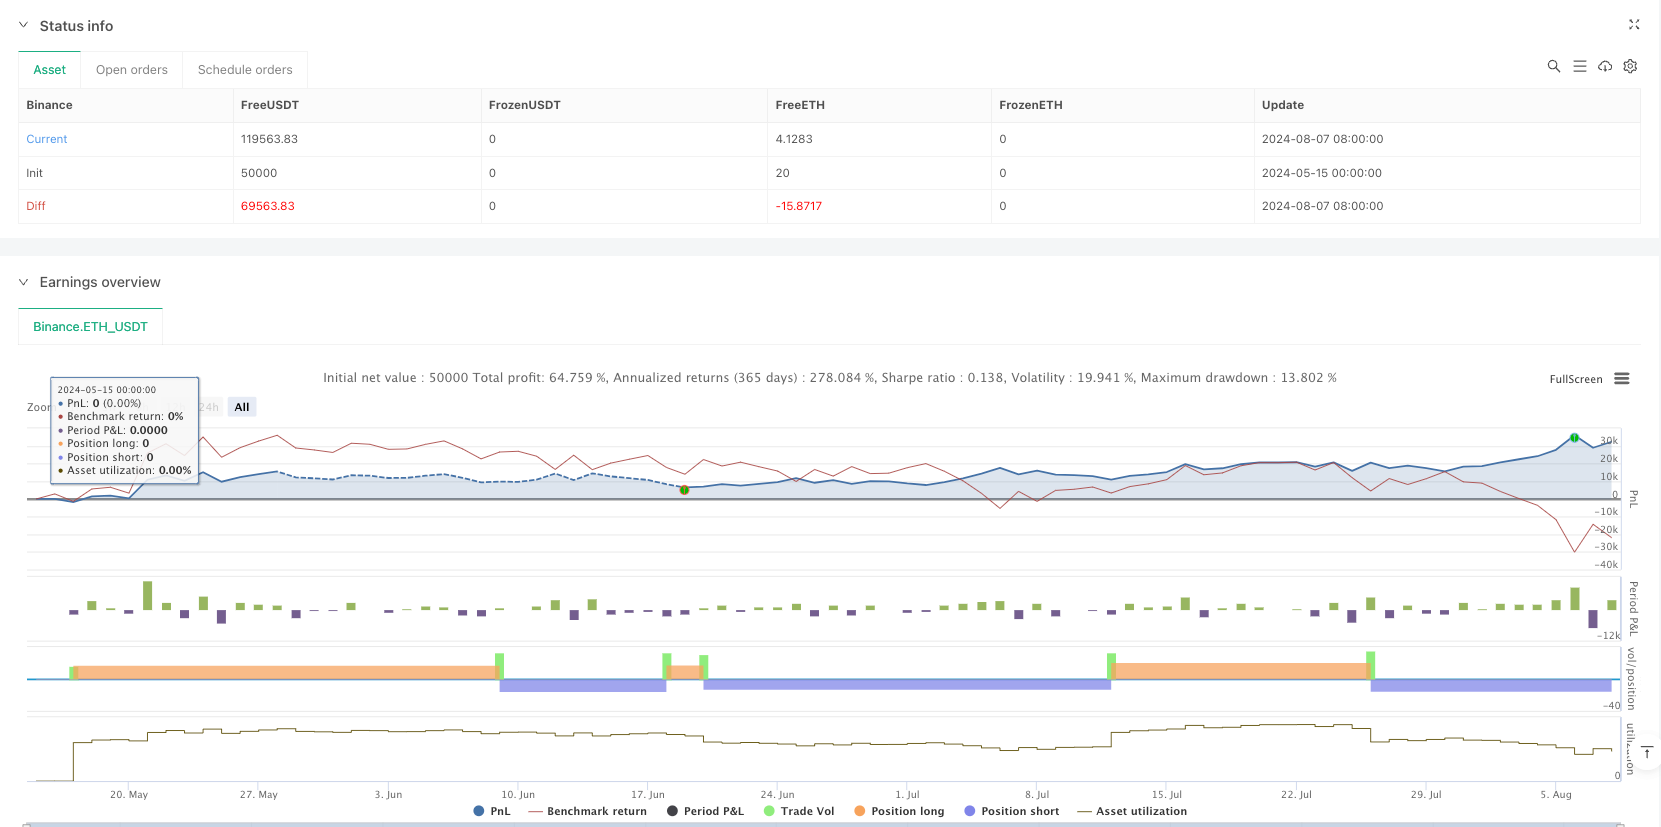
Es ist eine vollständige Handelsstrategie, die die dynamische Verfolgung von Stop-Loss- und Gleichgewichtssystemen kombiniert. Die Strategie kann durch die empfohlene Optimierung der Richtung weiter verbessert werden.
Strategiequellcode
/*backtest
start: 2024-05-15 00:00:00
end: 2024-08-08 00:00:00
period: 1d
basePeriod: 1d
exchanges: [{"eid":"Binance","currency":"ETH_USDT"}]
*/

//@version=6
strategy(title="UT Bot Strategy", overlay=true, default_qty_type=strategy.percent_of_equity, default_qty_value=100)

// Inputs
a = input.float(1, title="Key Value. 'This changes the sensitivity'")
c = input.int(10, title="ATR Period")
h = input.bool(false, title="Signals from Heikin Ashi Candles")

// Calculate ATR
xATR = ta.atr(c)
nLoss = a * xATR

// Source for calculations
src = h ? request.security(syminfo.tickerid, timeframe.period, hlc3) : close

// ATR Trailing Stop logic
var float xATRTrailingStop = na
if (not na(xATRTrailingStop[1]) and src > xATRTrailingStop[1] and src[1] > xATRTrailingStop[1])
    xATRTrailingStop := math.max(xATRTrailingStop[1], src - nLoss)
else if (not na(xATRTrailingStop[1]) and src < xATRTrailingStop[1] and src[1] < xATRTrailingStop[1])
    xATRTrailingStop := math.min(xATRTrailingStop[1], src + nLoss)
else
    xATRTrailingStop := src > xATRTrailingStop[1] ? src - nLoss : src + nLoss

// Position logic
var int pos = 0
if (not na(xATRTrailingStop[1]) and src[1] < xATRTrailingStop[1] and src > xATRTrailingStop[1])
    pos := 1
else if (not na(xATRTrailingStop[1]) and src[1] > xATRTrailingStop[1] and src < xATRTrailingStop[1])
    pos := -1
else
    pos := pos[1]

xcolor = pos == -1 ? color.red : pos == 1 ? color.green : color.blue

// Entry and Exit Signals
ema = ta.ema(src, 1)
above = ta.crossover(ema, xATRTrailingStop)
below = ta.crossover(xATRTrailingStop, ema)

buy = src > xATRTrailingStop and above
sell = src < xATRTrailingStop and below

// Strategy Execution
if (buy)
    strategy.entry("UT Long", strategy.long)
if (sell)
    strategy.entry("UT Short", strategy.short)

// Plotting and Alerts
plotshape(buy, title="Buy", text='Buy', style=shape.labelup, location=location.belowbar, color=color.green, textcolor=color.white, size=size.tiny)
plotshape(sell, title="Sell", text='Sell', style=shape.labeldown, location=location.abovebar, color=color.red, textcolor=color.white, size=size.tiny)

barcolor(src > xATRTrailingStop ? color.green : src < xATRTrailingStop ? color.red : na)

alertcondition(buy, title="UT Long", message="UT Long")
alertcondition(sell, title="UT Short", message="UT Short")