Dynamische Trend-Momentum-Crossover-Strategie - Quantitatives Handelssystem basierend auf dualen EMA- und MACD-Indikatoren

Überblick
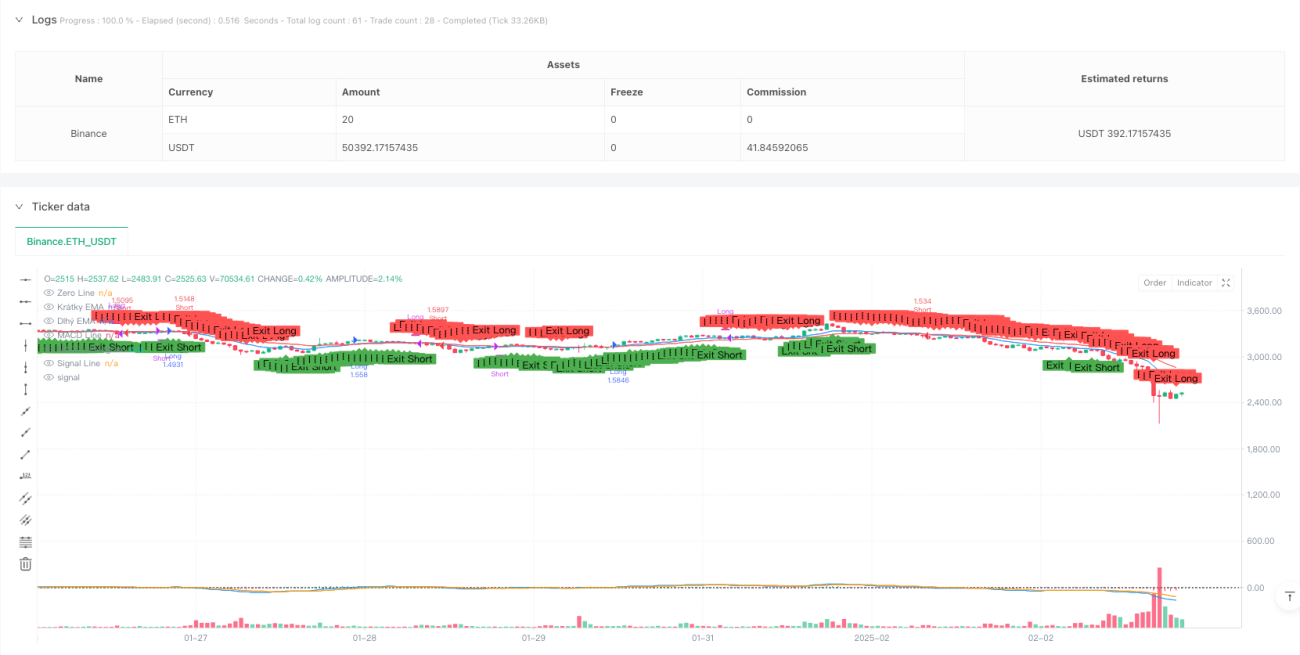
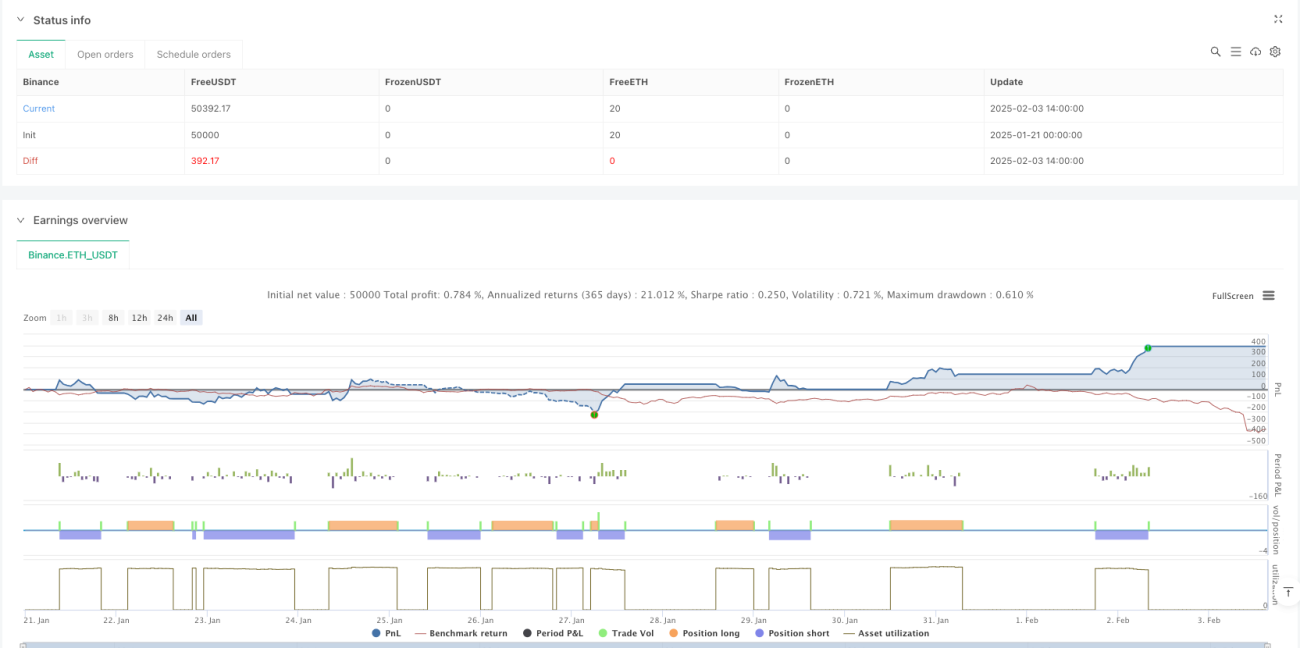
Die Strategie ist ein quantifiziertes Handelssystem, das die Indikatoren Index Moving Average (EMA) und Moving Average Trend/Abweichung (MACD) kombiniert. Durch die Integration von Kreuzsignalen aus kurz- und langfristigen EMAs sowie die Bestätigung von MACD-Dynamik bietet sie den Händlern eine umfassende Trend-Tracking-Lösung. Die Strategie enthält auch eine dynamische Stop-Loss- und Stop-Stop-Mechanik, um Risiken effektiv zu kontrollieren und gleichzeitig die Gewinne zu maximieren.
Strategieprinzip
Die Kernlogik der Strategie basiert auf der Synergie von zwei technischen Indikatoren. Erstens wird ein 12- und 26-Zyklen-EMA verwendet, um einen Markttrend zu erkennen. Wenn ein langfristiger EMA auf einem kurzfristigen EMA überschritten wird, wird ein Mehr-Signal erzeugt, und ein Unterschritt erzeugt ein Negativsignal.
Strategische Vorteile
- Verbesserte Signalbestätigungsmechanismen: Doppelbestätigung durch EMA-Kreuzung und MACD-Dynamik, um das Risiko eines falschen Durchbruchs deutlich zu reduzieren
- Risikomanagement Flexibilität: Prozentsatz Stop-Loss-Stopps, die sich an unterschiedliche Marktbedingungen und Handelsarten anpassen lassen
- Sehr gut visualisiert: EMA-Linien, MACD-Indikatoren und Handelssignalmarkierungen sind klar auf der Grafik zu sehen
- Anpassbarkeit der Parameter: Anpassung der EMA-Zyklen, der MACD-Parameter und der Risikokontrollquote an verschiedene Handelsstrategien
Strategisches Risiko
- Risiko einer Trendumkehr: Häufige Kreuzungen können in einem schwankenden Markt zu falschen Signalen führen
- Rückstandsprobleme: Die EMA und der MACD sind Rückstandsindikatoren, die bei schnellen Trends die besten Einstiegspunkte verpassen können
- Kapitalmanagementrisiken: Ein fester Stop-Loss-Prozentsatz kann bei hoher Volatilität nicht flexibel sein
- Risiken der Parameteroptimierung: Überoptimierung kann dazu führen, dass die Strategie in der Realität nicht mit den Rückmeldungen übereinstimmt
Richtung der Strategieoptimierung
- Einführung von Volatilitätsindikatoren: Es wird empfohlen, ATR-Indikatoren hinzuzufügen, um Stop-Loss- und Stop-Stop-Levels dynamisch anzupassen
- Erhöhung der Marktumgebung Filter: Sie können die Stärke des Trends anhand von Indikatoren wie ADX beurteilen, um den Handel in einem wackligen Markt zu vermeiden
- Optimierte Signalbestätigungsmechanismen: Erwägen Sie die Hinzufügung von Lieferbestätigungen oder anderen Dynamikindikatoren als Hilfsmittel
- Verbesserung der Geldverwaltung: Implementierung eines dynamischen Positionsmanagementsystems auf der Grundlage von Kontoansprüchen
Zusammenfassen
Es ist eine Strategie, die durch die Kombination der Vorteile der EMA und MACD, während die Strategie einfach und verständlich zu halten, eine zuverlässige Trading-Signal-Generierung. Die Strategie ist stark anpassungsfähig, die Risikomanagement-Mechanismen zu verbessern, geeignet für die Mittel-und langfristige Trend-Handel Grundrahmen.
- 1