Duale Momentum-Trendumkehrstrategie basierend auf RSI und stochastischem RSI

Überblick
Es handelt sich um eine Trendwende-Trading-Strategie, die einen relativ schwachen RSI und einen zufällig schwachen Stochastic RSI kombiniert. Die Strategie erfasst potenzielle Wendepunkte durch die Identifizierung von Überkauf-Überverkauf-Zuständen in den Märkten und der Veränderung der Dynamik. Der Kern der Strategie besteht darin, den RSI als Basis-Dynamik-Indikator zu verwenden und auf dieser Grundlage den Stochastic RSI zu berechnen, um die Richtung der Preisdynamik weiter zu bestätigen.
Strategieprinzip
Die Hauptlogik der Strategie umfasst folgende Schlüsselschritte:
- Zuerst berechnet man den RSI-Wert für den Schlusskurs, um zu beurteilen, ob der Gesamtwert überkauft oder überverkauft ist.
- Berechnung der %K- und %D-Linien des stochastischen RSI anhand des RSI-Wertes
- Wenn der RSI in der Überverkaufszone (default unter 30) ist und die %K-Linie des stochastischen RSI die %D-Linie von unten nach oben durchquert, wird ein Mehrsignal ausgelöst
- Trigger des Shorting-Signals, wenn der RSI in der Überkaufzone (default über 70) ist und die %K-Linie des stochastischen RSI die %D-Linie von oben nach unten durchquert
- Ein Ausgang aus der Ausgleichsposition erfolgt, wenn ein umgekehrter RSI-Zustand oder ein Stochastic RSI-Umkehrkreuz auftritt.
Strategische Vorteile
- Dual-Confirmation-Mechanismus - durch die Kombination von RSI und Stochastic RSI kann das Risiko von False-Breakouts wirksam reduziert werden
- Benutzerdefinierte Parameter - Schlüsselparameter der Strategie wie RSI-Zyklen, Überkauf-Überverkauf-Trenchwerte können an unterschiedliche Marktbedingungen angepasst werden
- Dynamische Visualisierung - Die Strategie bietet eine Live-Chartaufstellung des RSI und des Stochastic RSI, um den Händler zu überwachen
- Risikomanagement-Integration - umfasst vollständige Stop-Loss- und Profit-Closing-Mechanismen
- Anpassungsfähigkeit - für unterschiedliche Zeiträume und Marktumgebungen
Strategisches Risiko
- Schwankungsrisiken - häufige Falschsignale in schwankenden Märkten
- Gefahr von Verzögerung - ein gewisses Maß an Verzögerung des Signals kann auftreten, da mehrere Durchschnittslinien verwendet werden
- Parameter-Sensitivität - unterschiedliche Parameter-Einstellungen können zu deutlich unterschiedlichen Transaktionsergebnissen führen
- Marktumfeld-Abhängigkeit - in stark trendigen Märkten kann ein Teil des Handels verpasst werden
- Risikomanagement - eine angemessene Positionsquote zur Risikokontrolle
Richtung der Strategieoptimierung
- Hinzufügen eines Trendfilters - Der langfristige Moving Average kann als Trendfilter hinzugefügt werden, um nur in der Richtung des Trends zu handeln
- Optimierte Stop-Mechanismen - Dynamische Stop-Mechanismen wie Tracking Stop oder ATR Stop können eingeführt werden
- Einführung von Verkehrsmesswerten - Kombination mit Verkehrsanalysen kann die Signalsicherheit verbessern
- Zeitfilter hinzugefügt - um wichtige Nachrichten oder Zeiten mit geringer Mobilität zu vermeiden
- Entwicklung von Anpassungsparametern - Strategieparameter werden automatisch an Marktschwankungen angepasst
Zusammenfassen
Dies ist eine umfassende Strategie, die Dynamik und Trendwende kombiniert, um potenzielle Handelschancen durch die Synergie von RSI und Stochastic RSI zu identifizieren. Die Strategie ist vernünftig ausgelegt und hat eine gute Anpassungsfähigkeit und Anpassungsfähigkeit.
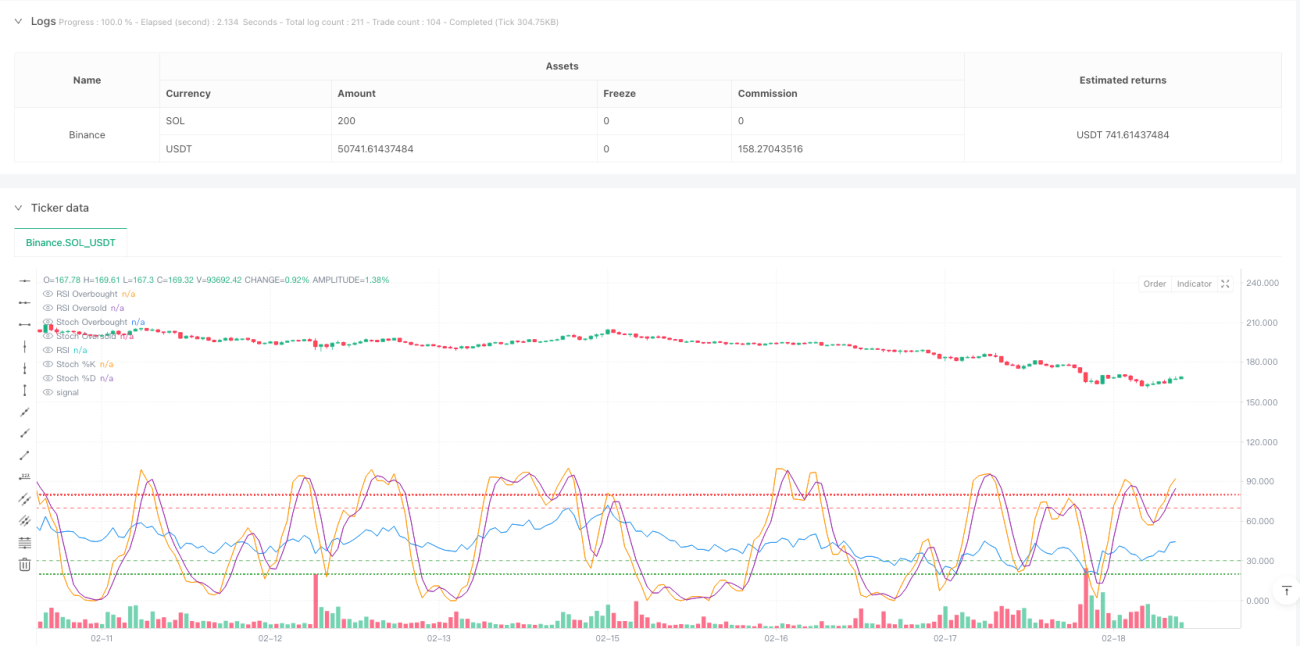
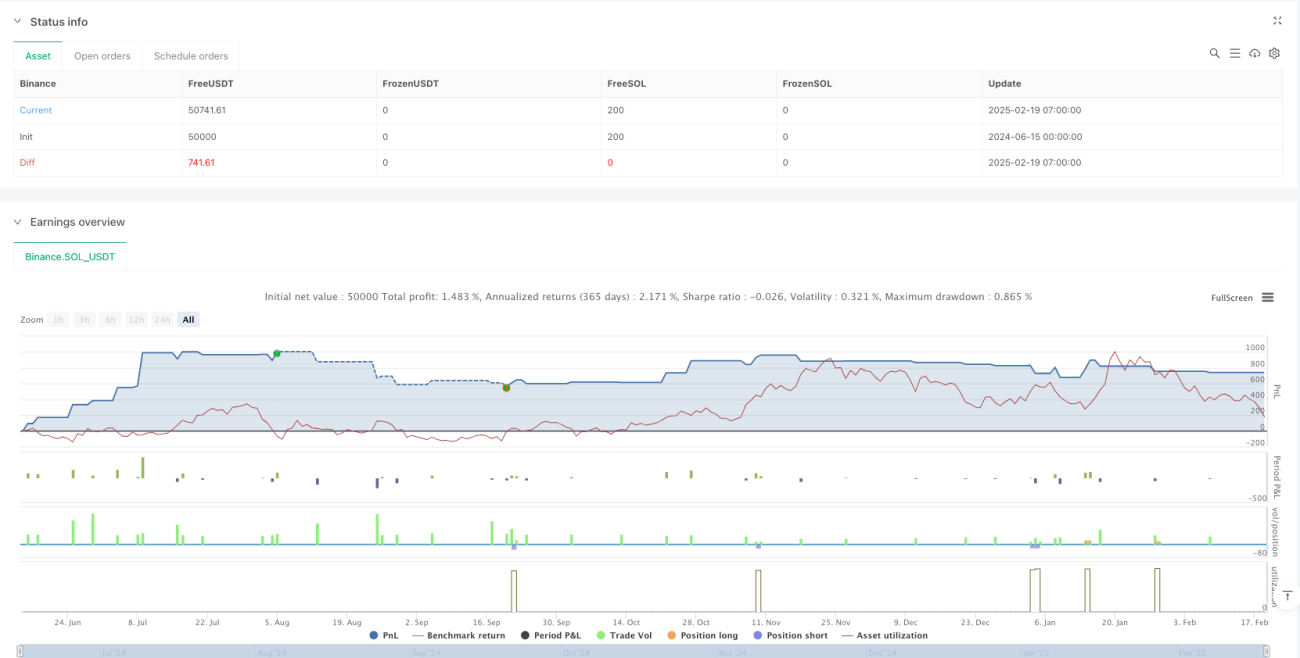
/*backtest
start: 2024-06-15 00:00:00
end: 2025-02-19 08:00:00
period: 1h
basePeriod: 1h
exchanges: [{"eid":"Binance","currency":"SOL_USDT"}]
*/

//@version=5
strategy("RSI + Stochastic RSI Strategy", overlay=true, initial_capital=100000, default_qty_type=strategy.percent_of_equity, default_qty_value=10)

// INPUTS- 1