
Überblick
Die Strategie ist eine innovative quantitative Handelsmethode, die sich auf die präzise Erfassung von Handelssignalen und die Risikomanagement durch die Kombination von Supertrends, Index-Moving Averages (EMA) und relativ starken Indizes (RSI) konzentriert. Die Strategie soll den Händlern eine dynamische, mehrdimensionale Markttrend-Tracking-Mechanismus bieten, der flexibel auf 1-minütigen, 5-minütigen und 15-minütigen Charts angewendet werden kann.
Strategieprinzip
Die Kernprinzipien der Strategie basieren auf der Synergie von drei wichtigen technischen Indikatoren:
- Supertrend: Bereitstellung von Markttrends durch Berechnung der durchschnittlichen realen Bandbreite der Fluktuation (ATR) und der Richtung der Preisveränderung.
- Indikatorische Moving Averages (EMA): als dynamische Unterstützungs-/Widerstandslinie, die bei der Bestimmung der Position der relativen Durchschnittspreise hilft.
- Der Relative Strength Index (RSI) bewertet die Marktdynamik und identifiziert Überkäufe und Überverkäufe.
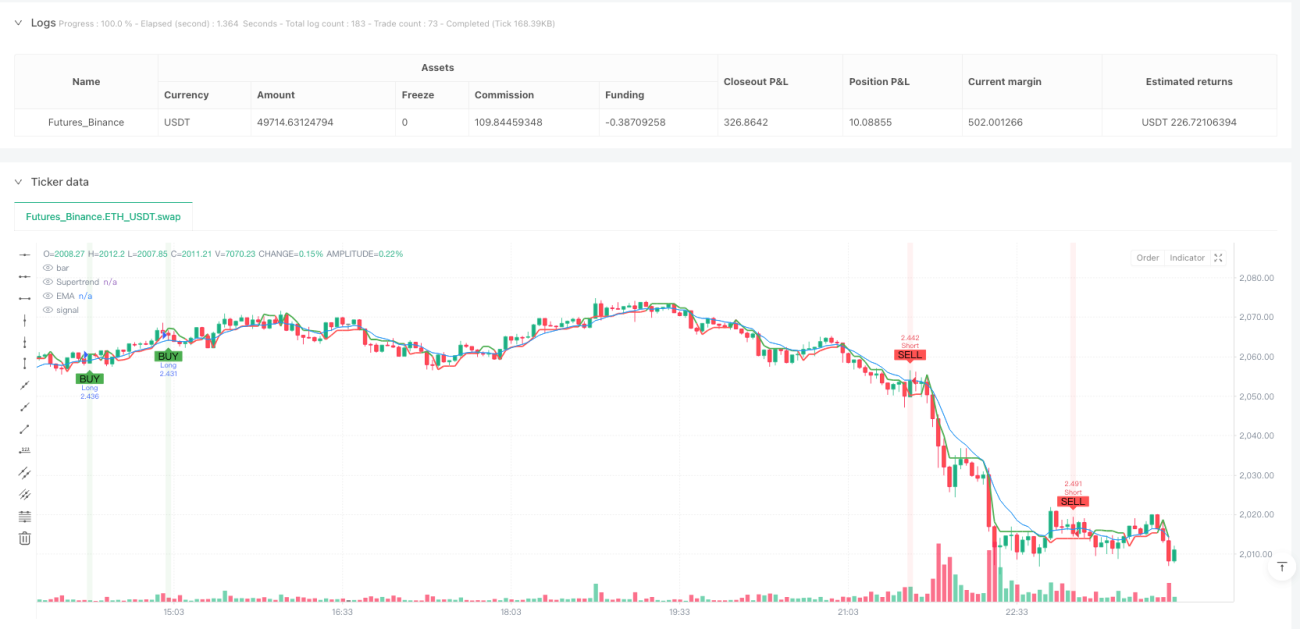
Die Strategie erzeugt Handelssignale durch die Kombination von drei Indikatoren:
- Mehr Signal: Supertrend ist mehr als der Kopf + Preis ist höher als EMA + RSI ist höher als 40
- Abbruchsignal: Supertrend ist leer + Preis unterhalb der EMA + RSI unter 60
Strategische Vorteile
- Multi-Dimensionalsignal-Verifizierung: Die Signalzuverlässigkeit wird durch eine dreifache Cross-Verifizierung deutlich erhöht.
- Dynamisches Risikomanagement: Die Verwendung von ATR-basierten Stop-Loss- und Stop-Stop-Mechanismen ermöglicht die Anpassung an Marktschwankungen.
- Flexibel: Die Anwendung ist in mehreren Zeitspannen möglich (eine Minute, fünf Minuten, 15 Minuten).
- Eine einzige Position: Nur eine Position ist zugelassen, um die Risiken des Handels zu kontrollieren.
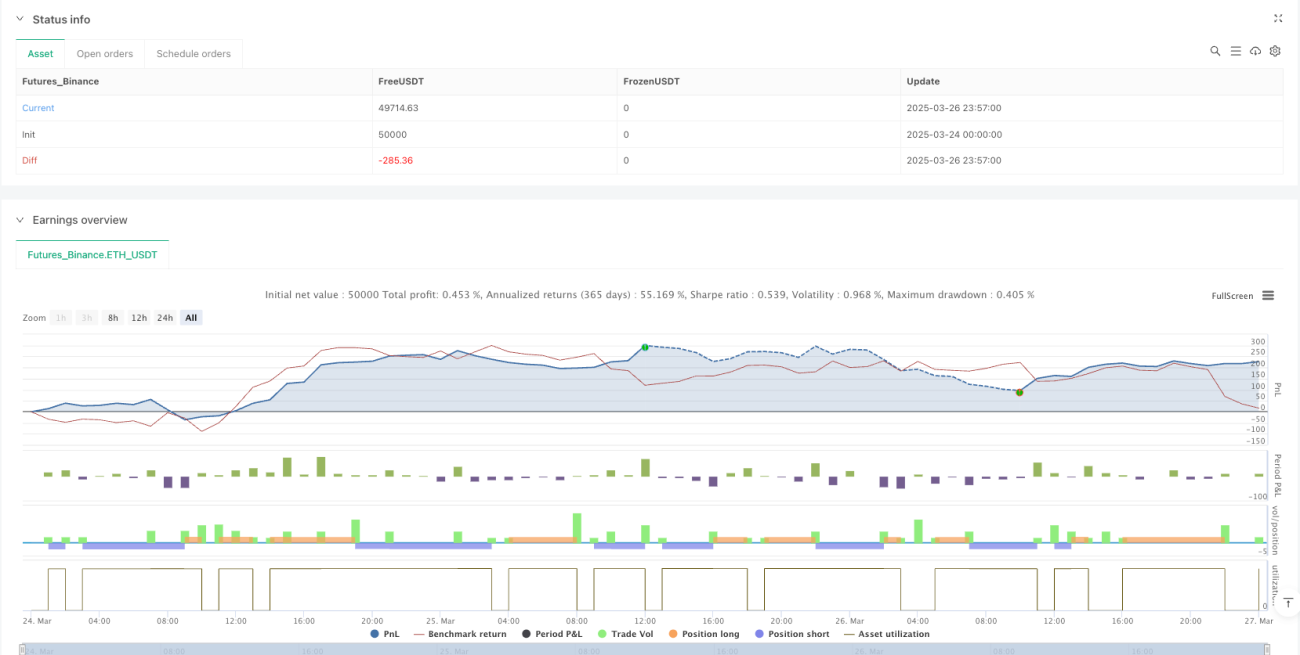
- Visuelle Unterstützung: Bereitstellung von klaren Kauf- und Verkaufssignalmarkierungen und Tabellen mit wichtigen Kennzahlen.
Strategisches Risiko
- Indikatorverzögerung: Die technischen Indikatoren sind von bestimmten historischen Daten abhängig, was zu Signalverzögerungen führen kann.
- Einfluss auf die Volatilität: In einem stark volatilen Markt kann ein Stop-Loss häufig ausgelöst werden.
- Parameter-Sensitivität: ATR-Länge, EMA-Zyklen und RSI-Trenchwerte beeinflussen die Strategie deutlich.
- Transaktionskosten: Häufige Transaktionen können zu hohen Gebühren führen.
Richtung der Strategieoptimierung
- Anpassungsparameter: Einführung von Algorithmen für maschinelles Lernen, die die Parameter dynamisch an die Marktbedingungen anpassen.
- Multi-Horizontal-Palette: kombiniert mit Trend-Tracking und Umkehr-Strategien, ausgeglichen mit Strategie-Stabilität.
- Risikoverteilung: Optimierung des Positionsmanagements und Einführung einer dynamischen Positionsgrößenkontrolle.
- Mehrzeit-Verifizierung: Signal-Verifizierungsmechanismen, die mehr Zeiträume hinzufügen.
- Optimierung der Transaktionskosten: Verringerung der Transaktionsfrequenz und unnötige Transaktionen.
Zusammenfassen
Es ist eine quantitative Handelsstrategie, die multidimensionale technische Analysen kombiniert und den Händlern durch die Synergie von Supertrends, EMA und RSI einen dynamischen, flexiblen Handelsentscheidungsrahmen bietet. Die Kernvorteile der Strategie liegen in der Multi-Signal-Verifizierung und der Anpassungsfähigkeit der Risikomanagementmechanismen, aber auch in der ständigen Optimierung und Anpassung der Händler.
/*backtest
start: 2025-03-24 00:00:00
end: 2025-03-27 00:00:00
period: 3m
basePeriod: 3m
exchanges: [{"eid":"Futures_Binance","currency":"ETH_USDT"}]
*/

//@version=6
strategy("SOL Scalper - Supertrend + EMA + RSI (One Position at a Time)", overlay=true, initial_capital=1000, default_qty_type=strategy.percent_of_equity, default_qty_value=10, commission_type=strategy.commission.percent, commission_value=0.075)

// Inputs- 1