
Überblick
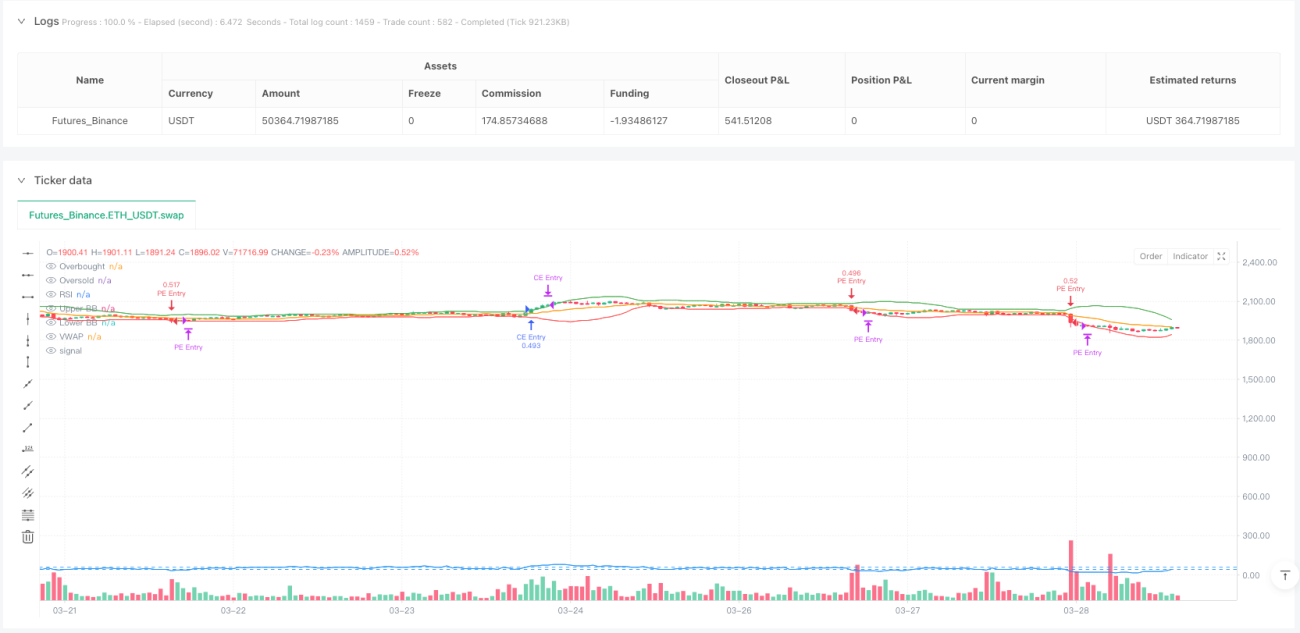
Dies ist eine dynamische Option-Trading-Strategie, die auf mehreren technischen Indikatoren basiert und die durch eine umfassende Analyse der Marktvolatilität, -trends und -dynamik zu identifizieren ist. Die Strategie kombiniert mehrere technische Indikatoren wie die durchschnittliche reale Wellenlänge (ATR), die Bollinger Bands (BB), der relativ starke Index (RSI) und der durchschnittlich gewichtete Preis (VWAP), um einen umfassenden Rahmen für Handelsentscheidungen zu bilden.
Strategieprinzip
Das Kernprinzip der Strategie besteht darin, mehrere Marktsignale zu nutzen, um eine Handelsentscheidung zu treffen. Die wichtigsten Schritte sind:
- Verwendung von Brin-Bändern als Preis-Break Signal
- Der RSI beurteilt den Markt als überkauft und überverkauft.
- Trendbestätigung durch Abweichungen im Transaktionsvolumen
- Die ATR wird verwendet, um dynamische Stop-Loss- und Stop-Stop-Ziele zu berechnen.
- Setzen Sie eine Risikobegrenzung für die maximale Laufzeit
Strategische Vorteile
- Multi-Faktor-Analyse verbessert die Genauigkeit von Handelssignalen
- Dynamische Stopp- und Stoppmechanismen zur effektiven Risikokontrolle
- Flexible Parameter-Einstellungen für unterschiedliche Marktumgebungen
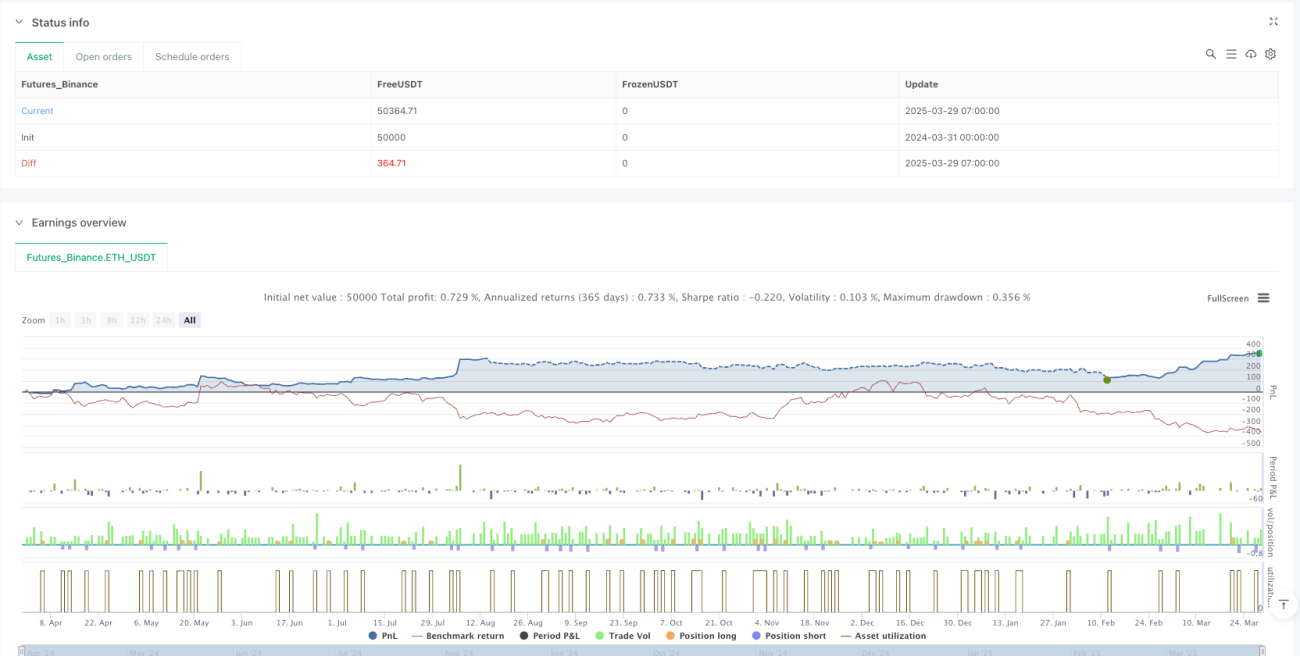
- Die Rückmeldung zeigt eine höhere Gewinnquote und einen höheren Gewinnfaktor.
- Zeitbasierte Ausstiegsstrategien zur Verhinderung von Überlagerungen
Strategisches Risiko
- Technische Verzögerungen können zu falschen Signalen führen
- Hochvolatile Märkte können die Komplexität der Transaktionen erhöhen
- Die Parameterwahl ist entscheidend für die Strategie
- Transaktionskosten und Schlupfpunkte können sich auf die tatsächlichen Erträge auswirken
- Schnelle Veränderungen der Marktbedingungen können die Effektivität der Strategie beeinträchtigen
Richtung der Strategieoptimierung
- Einführung von Algorithmen des maschinellen Lernens zur Optimierung der Parameterauswahl
- Mehr Indikatoren für die Stimmung in den Märkten
- Entwicklung eines Anpassungsmechanismus für dynamische Parameter
- Optimierung des Risikomanagement-Moduls
- Einführung von Analysen für die Marktzusammenhänge
Zusammenfassen
Die Strategie erstellt eine relativ robuste Options-Handel-Rahmen durch Multi-Faktor-Analyse. Durch die integrierte Verwendung von technischen Indikatoren, Risikokontrolle und dynamische Ausstiegsmechanismen bietet es den Händlern eine systematische Handelsmethode. Jede Handelsstrategie erfordert jedoch eine ständige Verifizierung und Optimierung.
Performance Metrics
-
Fünf-Minuten-Zyklus:
- Siegquote: 77,6 Prozent
- Gewinnfaktor 3,52
- Maximale Rücknahme: 8,1 Prozent
- Durchschnittliche Laufzeit: 2,7 Stunden
-
15 Minuten im Zyklus:
- Siegquote: 75,9 Prozent
- Einnahmenfaktor: 3,09
- Maximale Rücknahme: 9,4 Prozent
- Durchschnittliche Dauer der Transaktion: 3,1 Stunden
/*backtest
start: 2024-03-31 00:00:00
end: 2025-03-29 08:00:00
period: 1h
basePeriod: 1h
exchanges: [{"eid":"Futures_Binance","currency":"ETH_USDT"}]
*/

//@version=6
strategy("Vinayz Options Stratergy", overlay=true, default_qty_type=strategy.percent_of_equity, default_qty_value=2)

// ---- Input Parameters ----- 1