
Überblick
Die PowerZone-Handelsstrategie ist eine innovative automatisierte Handelsmethode, die darauf abzielt, starke Preisbewegungen im Markt zu erfassen. Durch die Identifizierung spezifischer Preiszonen (sogenannte "PowerZones") liefert die Strategie dem Händler klare Ein- und Ausstiegssignale und verfügt gleichzeitig über ein integriertes Risikomanagement.
Strategieprinzip
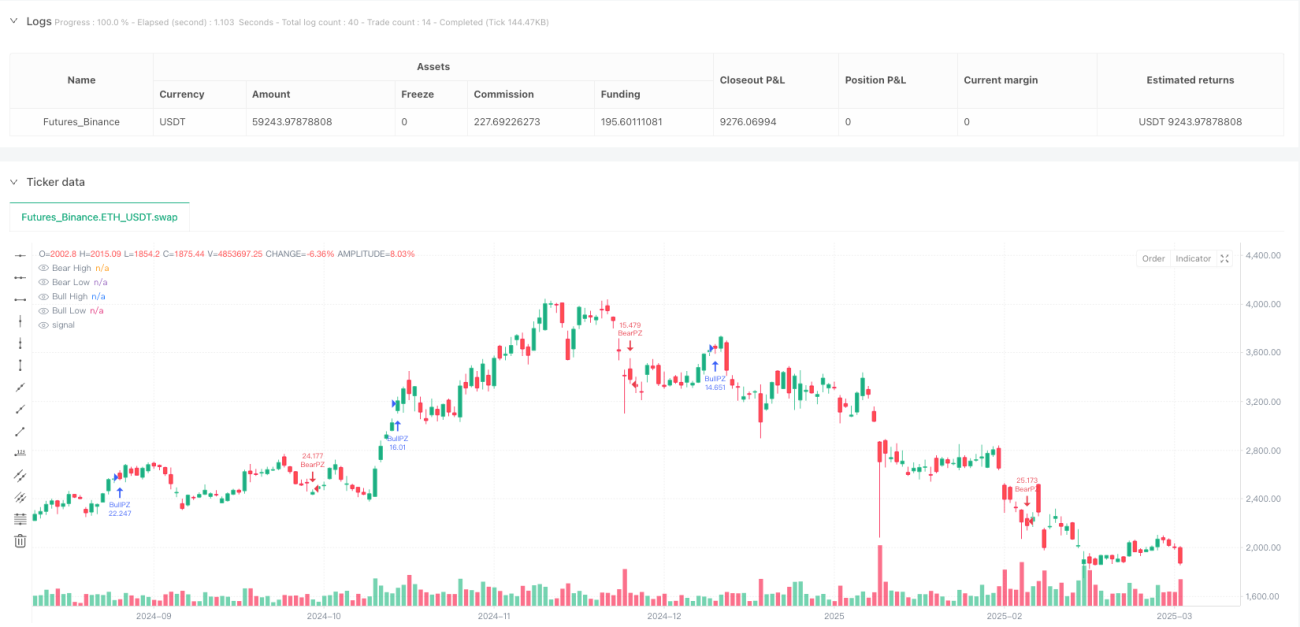
Der Kern der Strategie liegt in der Erkennung von zwei entscheidenden PowerZone-Typen:
-
Bullische PowerZone:
- Beginnt mit einer bärischen Kerze (Schlusskurs unter Eröffnungskurs)
- Anschließend folgen mehrere aufeinanderfolgende Kerzen (standardmäßig 5) mit Aufwärtstrend
- Die gesamte Preisbewegung übersteigt einen voreingestellten Schwellenwert (standardmäßig 2 %)
-
Bärische PowerZone:
- Beginnt mit einer bullischen Kerze (Schlusskurs über Eröffnungskurs)
- Anschließend folgen mehrere aufeinanderfolgende Kerzen mit Abwärtstrend
- Die gesamte Preisbewegung übersteigt einen voreingestellten Schwellenwert
Vorteile der Strategie
- Automatisierte Erkennung von Trendwendepunkten
- Integrierte flexible Parameteranpassung
- Klare visuelle Darstellung
- Automatisches Risikomanagement (Take Profit / Stop Loss)
- Geeignet für verschiedene Marktbedingungen
- Kompakter Code, leicht verständlich und modifizierbar
Risiken der Strategie
- Falsche Parametereinstellungen können zu übermäßigem Handel führen
- In Seitwärtsmärkten können Fehlsignale auftreten
- Feste Positionsgrößen können das Risiko einzelner Verlusttrades erhöhen
- Mangel an komplexen Filtermechanismen
- Breitere Markttrends und -zyklen werden nicht berücksichtigt
Optimierungsmöglichkeiten der Strategie
-
Einführung zusätzlicher Filterbedingungen
- Kombination mit Trendindikatoren (z. B. EMA)
- Integration von Momentum-Indikatoren (z. B. RSI)
- Hinzufügen eines Volumenbestätigungsmechanismus
-
Dynamisches Positionsmanagement
- Anpassung der Positionsgröße an die Marktvolatilität
- Umsetzung einer prozentualen Risikokontrolle
-
Multi-Timeframe-Validierung
- Kreuzvalidierung von Signalen über verschiedene Zeitrahmen
- Erhöhung der Zuverlässigkeit der Signale
Zusammenfassung
Die PowerZone-Handelsstrategie bietet Händlern durch die systematische Identifizierung von Preisstärkezonen eine strukturierte Handelsmethode. Ihre Hauptvorteile liegen in der Automatisierung, Visualisierung und Flexibilität. Gleichzeitig erfordert sie jedoch eine sorgfältige Parameteranpassung und eine kontinuierliche Optimierung des Risikomanagements.
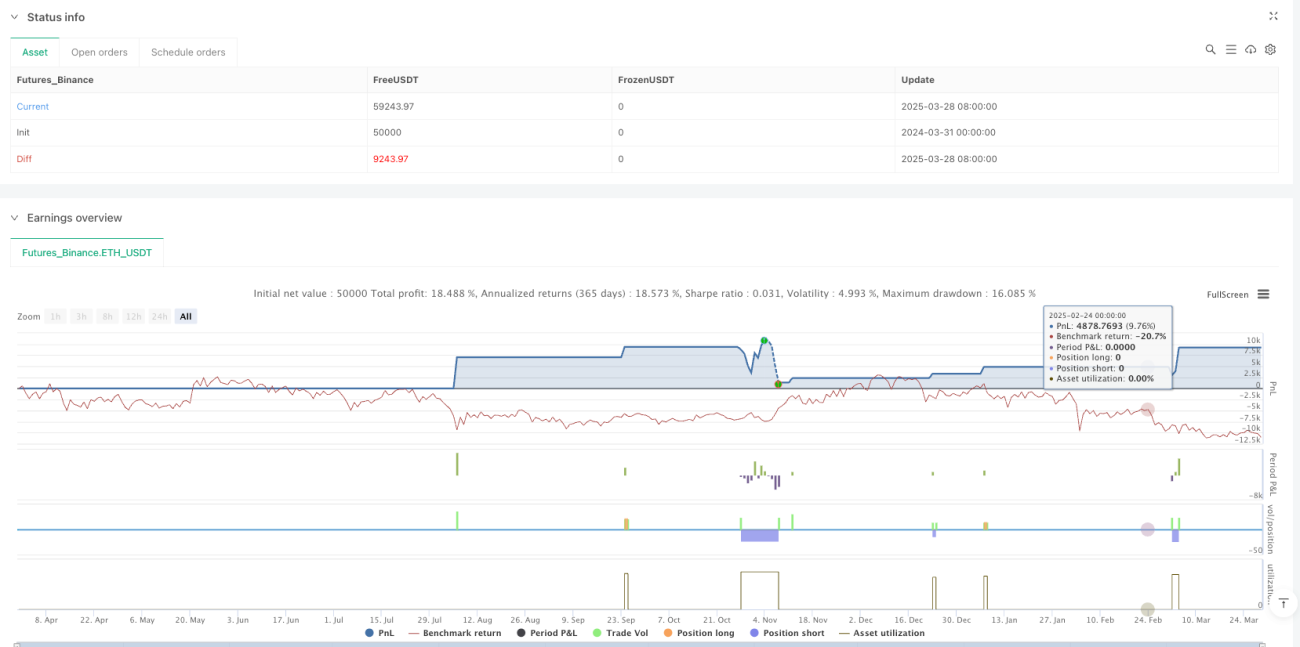
/*backtest
start: 2024-03-31 00:00:00
end: 2025-03-29 08:00:00
period: 1d
basePeriod: 1d
exchanges: [{"eid":"Futures_Binance","currency":"ETH_USDT"}]
*/

// This Pine Script® code is subject to the terms of the Mozilla Public License 2.0 at https://mozilla.org/MPL/2.0/
// © tradingbauhaus

//@version=6- 1