
Überblick
Dieser Artikel stellt eine kombinierte Handelsstrategie vor, die Bollinger Bänder und den SuperTrend-Indikator vereint. Durch die Integration mehrerer technischer Analyseinstrumente zielt die Strategie darauf ab, präzisere Marktein- und -ausstiegssignale zu liefern und gleichzeitig das Handelsrisiko zu reduzieren.
Strategieprinzip
Der Kern der Strategie besteht aus zwei Hauptkomponenten: den Bollinger Bändern und dem SuperTrend-Indikator.
-
Berechnung der Bollinger Bänder:
- Verwendung eines konfigurierbaren gleitenden Durchschnitts (MA) zur Berechnung der Mittellinie
- Erzeugung von oberen und unteren Bändern basierend auf dem Vielfachen der Standardabweichung
- Unterstützung mehrerer Arten gleitender Durchschnitte: einfacher gleitender Durchschnitt (SMA), exponentieller gleitender Durchschnitt (EMA), geglätteter gleitender Durchschnitt (SMMA), gewichteter gleitender Durchschnitt (WMA) und volumengewichteter gleitender Durchschnitt (VWMA)
-
SuperTrend-Komponente:
- Nutzung der Average True Range (ATR) zur Berechnung von Stop-Loss-Niveaus
- Dynamische Bestimmung der Markttrendrichtung
- Erzeugung von Kauf- und Verkaufssignalen basierend auf Trendänderungen
Strategievorteile
- Mehrfachindikatorkombination: Durch die Kombination von Bollinger Bändern und SuperTrend wird die Signaltreue erhöht.
- Flexible Konfiguration: Art des gleitenden Durchschnitts, Parameter und Berechnungsmethode sind anpassbar.
- Dynamischer Stop-Loss: Der auf dem ATR basierende Stoppmechanismus ermöglicht eine effektive Risikokontrolle.
- Verbesserte Visualisierung: Bereitstellung von Trendzustandsfüllungen und Signalbeschriftungen.
- Risikomanagement: Prozentuales Positionsmanagement und Begrenzung von Pyramiding (Kaskadentrades) sind implementiert.
Strategierisiken
- Parameterempfindlichkeit: Unter verschiedenen Marktbedingungen können Parameteranpassungen erforderlich sein.
- Backtest-Einschränkungen: Historische Datenleistung garantiert keine zukünftige Marktentwicklung.
- Risiko von Long-/Short-Wechseln: Häufige Positionswechsel können die Handelskosten erhöhen.
- Verzögerung der Indikatoren: Technische Indikatoren weisen eine gewisse Signalverzögerung auf.
Optimierungsmöglichkeiten der Strategie
- Einführung maschineller Lernalgorithmen zur dynamischen Parameteroptimierung.
- Hinzufügen zusätzlicher Filterbedingungen, wie z. B. Bestätigung durch das Volumen.
- Entwicklung eines Mehrebenen-Zeitrahmen-Validierungsmechanismus.
- Optimierung des Risikomanagementmoduls und Einführung feinerer Positionskontrollstrategien.
Zusammenfassung
Dies ist eine Handelsstrategie, die mehrere dynamische Indikatoren kombiniert. Durch die Kombination von Bollinger Bändern und SuperTrend wird ein relativ umfassendes Handelssignal-System bereitgestellt. Der Kern der Strategie liegt in der Balance zwischen Signaltreue und Risikomanagement, dennoch sind kontinuierliche Optimierung und Anpassung an verschiedene Marktbedingungen erforderlich.
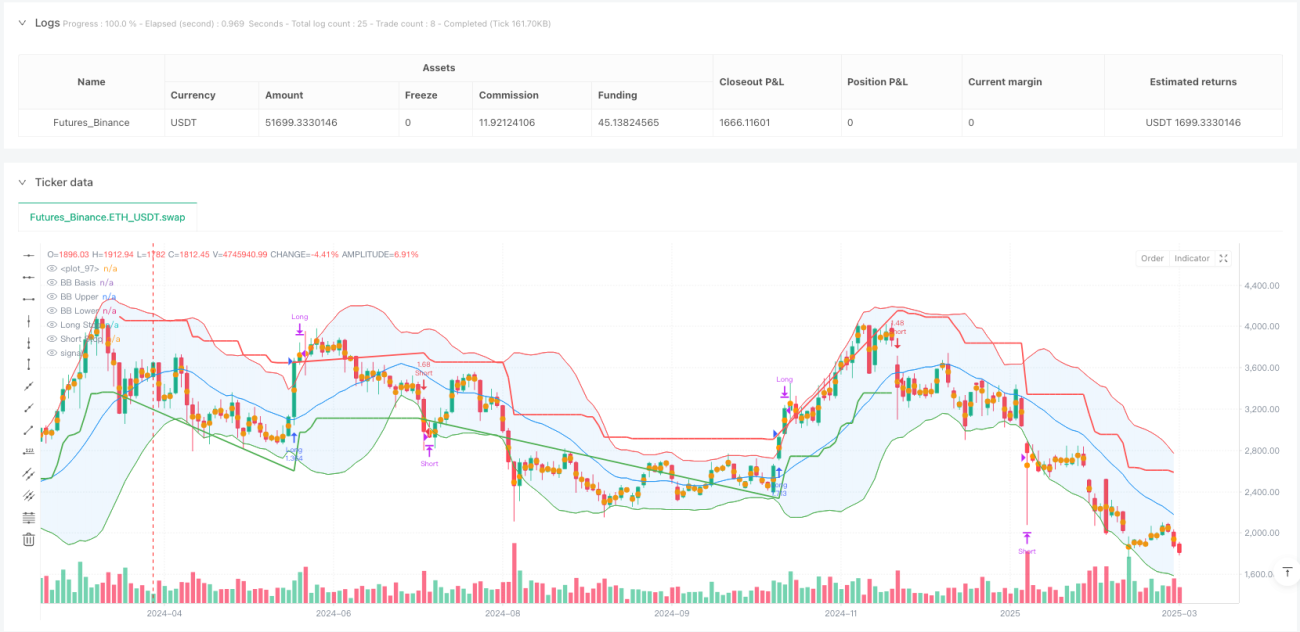
/*backtest
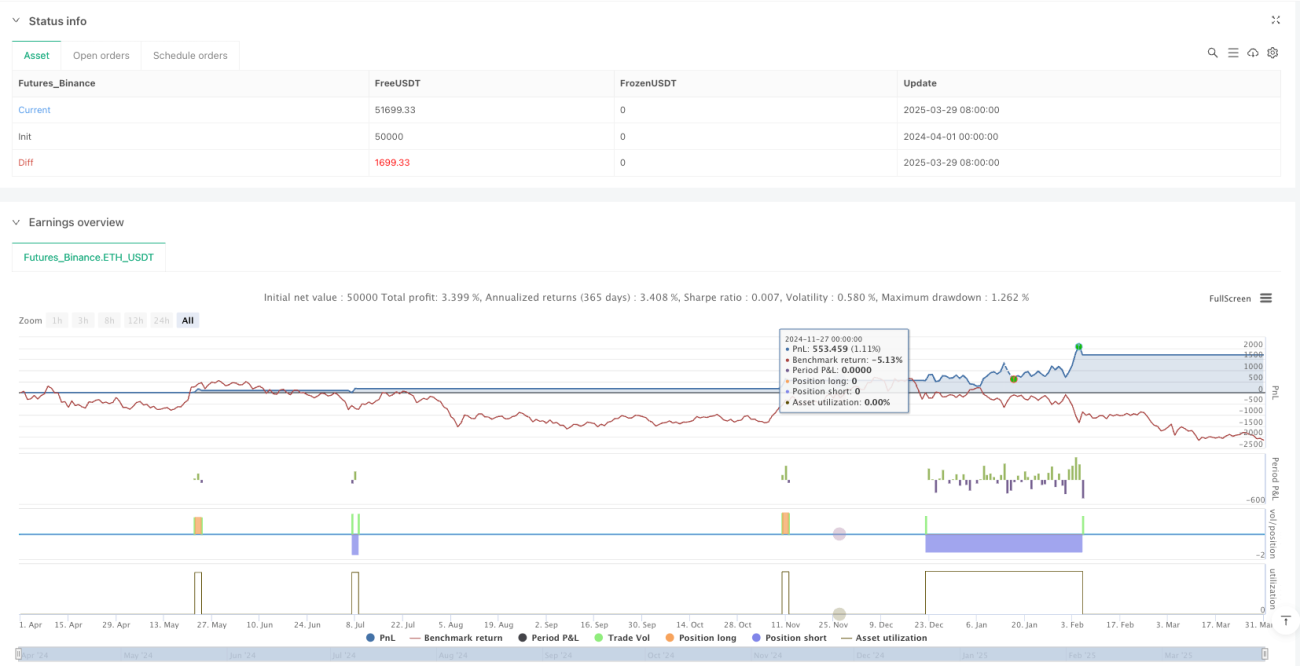
start: 2024-04-01 00:00:00
end: 2025-03-31 00:00:00
period: 2d
basePeriod: 2d
exchanges: [{"eid":"Futures_Binance","currency":"ETH_USDT"}]
*/
//@version=6
strategy("Combined BB & New SuperTrend Strategy", overlay=true, initial_capital=100000, default_qty_type=strategy.percent_of_equity, default_qty_value=10, pyramiding=0)
//============================- 1