
Übersicht
Hierbei handelt es sich um eine quantitative Handelsstrategie, die auf der Kreuzung mehrerer exponentiell gleitender Durchschnitte (EMA) basiert. Durch das Erkennen von Kreuzungen der EMA mit unterschiedlichen Zeiträumen wird der Markttrend identifiziert und Handelssignale generiert. Die Strategie zielt darauf ab, durch schrittweise Bestätigung die Marktdynamik zu erfassen und eine intuitive visuelle Trendbewertung zu ermöglichen.
Funktionsprinzip
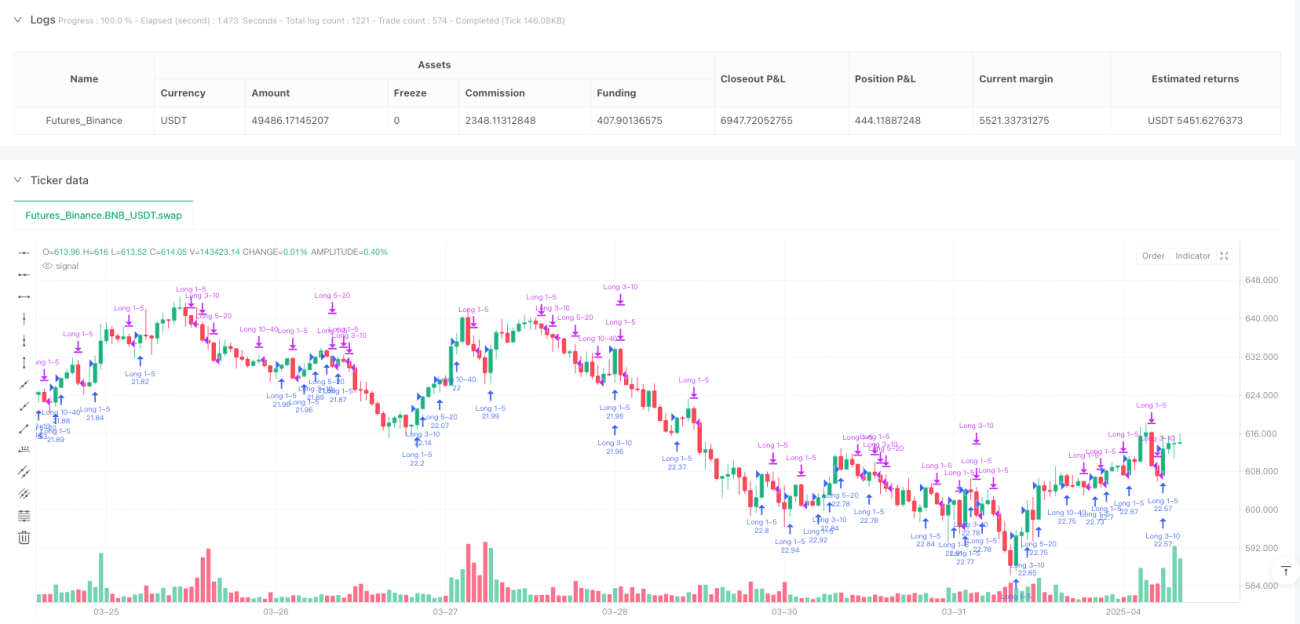
Die Kernlogik der Strategie basiert auf den Kreuzungssignalen von vier EMA mit unterschiedlichen Zeiträumen:
- Erstes Einstiegssignal: Der 1-Tage-EMA kreuzt über den 5-Tage-EMA und zeigt damit eine erste Aufwärtsdynamik an.
- Zweites Einstiegssignal: Der 3-Tage-EMA kreuzt über den 10-Tage-EMA und bestätigt einen stärkeren Aufwärtstrend.
- Drittes Einstiegssignal: Der 5-Tage-EMA kreuzt über den 20-Tage-EMA und zeigt die Weiterentwicklung des Trends an.
- Viertes Einstiegssignal: Der 10-Tage-EMA kreuzt über den 40-Tage-EMA und deutet auf eine langfristige bullische Dynamik hin.
Mithilfe einer Farbcodierung wird die Marktstimmung visuell dargestellt: Blautöne stehen für bullisch, Rottöne für bärisch. Die Farbintensität spiegelt die relative Position des kurzfristigen EMA zum langfristigen EMA wider.
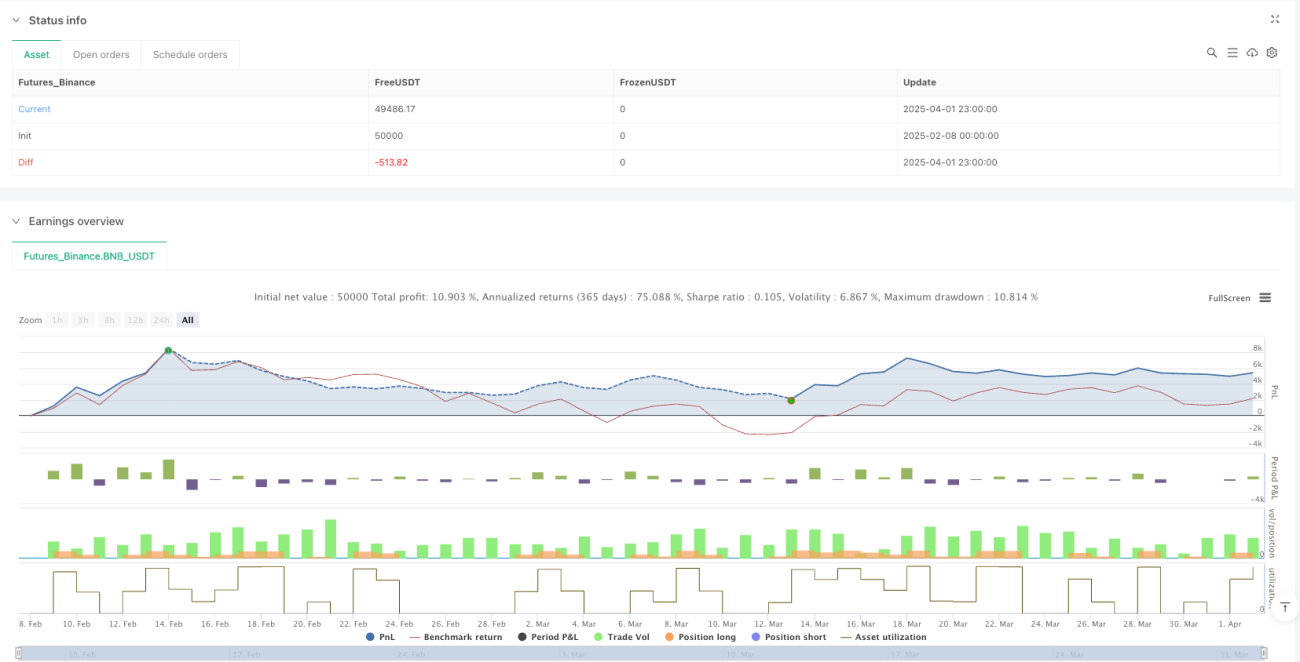
Vorteile der Strategie
- Schrittweise Bestätigung: Mehrfache EMA-Kreuzungen bieten eine abgestufte Trendbestätigung.
- Visuelles Feedback: Die Farbe der Balken zeigt schnell Veränderungen der Marktstimmung an.
- Hohe Flexibilität: Geeignet für Märkte mit ausgeprägten Trends wie Bitcoin.
- Dynamisches Positionsmanagement: Ermöglicht schrittweisen Positionsaufbau und reduziert das Risiko einzelner Trades.
- Trendfolgefähigkeit: Erfasst Marktdynamik auf verschiedenen Zeitskalen.
Risiken der Strategie
- Nachlaufend: EMA als nachlaufende Indikatoren können auf plötzliche Preisänderungen verzögert reagieren.
- Fehldurchbruchsrisiko: In Seitwärtsmärkten können Fehlsignale erzeugt werden.
- Long-Positionsrisiko: Der pyramidenartige Aufbau von Positionen kann das gesamte Risikoexposure erhöhen.
Optimierungsmöglichkeiten
- Einführung zusätzlicher Filterbedingungen, z. B. Volumenbestätigung oder Volatilitätsindikatoren.
- Integration von Stopp-Mechanismen, z. B. Anwendung der Kelly-Formel zur Kontrolle des Einzelhandelsrisikos.
- Anpassung der EMA-Parameter an unterschiedliche Marktbedingungen.
- Hinzufügen eines Moduls zur Bewertung der Trendstärke.
- Einsatz von maschinellem Lernen zur dynamischen Anpassung der Einstiegsstrategie.
Zusammenfassung
Die Mehrfach-EMA-Kreuzungsstrategie bietet Händlern durch schrittweise Signalerzeugung und eine intuitive visuelle Darstellung eine systematische Methode zur Erfassung von Markttrends. Obwohl sie gewisse Einschränkungen aufweist, besitzt die Strategie durch kontinuierliche Optimierung und Risikomanagement einen erheblichen praktischen Wert.
- 1