
Übersicht
Die Dow-Theorie-Trendadaptive-Momentum-Strategie ist eine fortschrittliche Handelsmethode, die auf den klassischen Prinzipien der Dow-Theorie basiert, indem sie Handelsentscheidungen durch die Identifizierung wichtiger Wendepunkte im Markttrend trifft. Die Strategie konzentriert sich auf die Erkennung und Bestätigung der grundlegenden Dynamik von Preistrends, wobei höhere Hochs (Higher Highs) und höhere Tiefs (Higher Lows) zur Definition eines Aufwärtstrends sowie niedrigere Hochs (Lower Highs) und niedrigere Tiefs (Lower Lows) zur Definition eines Abwärtstrends verwendet werden. Diese Methode zielt darauf ab, eine systematische Herangehensweise zur Erfassung von Markttrends zu bieten und rechtzeitig auf Trendänderungen zu reagieren.
Strategieprinzipien
Das Kernprinzip dieser Strategie basiert auf der klassischen Trendidentifikationsmethode der Dow-Theorie. Die Strategie erkennt wichtige Wendepunkte mit den Funktionen ta.pivothigh() und ta.pivotlow(). Die konkrete Umsetzung umfasst die folgenden wichtigen Schritte:
- Wendepunkt-Erkennung: Verwendet den Parameter
pivotLookback, um die Anzahl der Balken auf beiden Seiten zu bestimmen, um Hoch- und Tiefpunkte zu identifizieren. - Trendbestätigung: Ein Aufwärtstrend wird nur bestätigt, wenn sowohl höhere Hochs als auch höhere Tiefs erfüllt sind; entsprechend wird ein Abwärtstrend nur bestätigt, wenn sowohl niedrigere Hochs als auch niedrigere Tiefs vorliegen.
- Trendpersistenz: Sind die Trendwechselbedingungen nicht erfüllt, behält die Strategie den vorherigen Trendzustand bei, was eine gleichmäßigere Trendverfolgung ermöglicht.
Strategievorteile
- Dynamische Trendidentifikation: Durch die kontinuierliche Analyse wichtiger Wendepunkte kann die Strategie dynamisch Markttrendänderungen erfassen.
- Flexible Handelsmodi: Bietet drei Handelsmodi – automatisch, nur Long und nur Short – um den Bedürfnissen verschiedener Trader gerecht zu werden.
- Risikomanagement: Integrierte Stop-Loss- und Take-Profit-Mechanismen ermöglichen eine effektive Kontrolle des Risikos einzelner Trades.
- Trendvisualisierung: Zeigt die Trendrichtung intuitiv durch Hintergrundfarben und Markierungen an, sodass Trader die Marktsituation schnell erfassen können.
- Geringe Latenz: Im Vergleich zu traditionellen gleitenden-Durchschnitts-Strategien kann diese Methode schneller auf Trendänderungen reagieren.
Strategierisiken
- Verzögerungsrisiko: Aufgrund der Erkennung von Wendepunkten birgt die Strategie ein inhärentes Verzögerungsrisiko und kann die frühesten Trendsignale möglicherweise nicht erfassen.
- Seitwärtsmarktrisiko: In Märkten mit unklaren Schwankungen können häufige kleine Preisänderungen zu unnötigen Trades führen.
- Parametersensitivität: Die Wahl des Parameters
pivotLookbackhat erheblichen Einfluss auf die Strategieleistung und muss für verschiedene Märkte und Zeitrahmen angepasst werden. - Transaktionskosten: Häufiger Handel kann zu hohen Transaktionskosten führen, insbesondere bei hohen Provisionssätzen.
Strategieoptimierungsrichtungen
- Einführung zusätzlicher Filter: Kombination mit Trendstärke-Indikatoren (wie ATR), um schwache Trendsignale zu filtern.
- Dynamische Parameteranpassung: Entwicklung eines adaptiven
pivotLookback-Parameter-Mechanismus basierend auf der Marktvolatilität. - Mehrfachzeitrahmen-Validierung: Kreuzvalidierung von Trendsignalen in verschiedenen Zeitrahmen, um die Zuverlässigkeit der Signale zu erhöhen.
- Machine-Learning-Verstärkung: Erkundung des Einsatzes von Machine-Learning-Algorithmen zur Optimierung der Trendidentifikation und des Einstiegszeitpunkts.
- Risikomanagement-Optimierung: Dynamische Anpassung der Stop-Loss- und Take-Profit-Abstände basierend auf der Marktvolatilität.
Zusammenfassung
Die Dow-Theorie-Trendadaptive-Momentum-Strategie ist eine leistungsstarke Trendfolgemethode, die durch innovative Wendepunktanalyse-Techniken Händlern ein systematisches Werkzeug zur Trendidentifikation bietet. Trotz einiger inhärenter Risiken machen ihre Flexibilität und Dynamik sie zu einem wertvollen Ansatz im modernen quantitativen Handel. Die erfolgreiche Anwendung dieser Strategie erfordert ein tiefes Verständnis ihrer Funktionsweise sowie eine kontinuierliche Optimierung und Anpassung an die spezifischen Marktbedingungen.
- Einführung zusätzlicher Filter: Kombinieren Sie Trendstärkeindikatoren (wie ATR), um schwache Trendsignale herauszufiltern.
- Dynamische Parameteranpassung: Entwickeln Sie einen adaptiven pivotLookback-Parameter-Mechanismus basierend auf der Marktvolatilität.
- Multi-Timeframe-Verifizierung: Bestätigen Sie Trendsignale über verschiedene Zeitrahmen hinweg, um die Zuverlässigkeit der Signale zu erhöhen.
- Verbesserung durch maschinelles Lernen: Erkunden Sie den Einsatz von Algorithmen des maschinellen Lernens zur Optimierung der Trendidentifikation und des Einstiegszeitpunkts.
- Optimierung des Risikomanagements: Passen Sie Stop-Loss- und Take-Profit-Distanzen dynamisch an die Marktvolatilität an.
Fazit
Die Dow-Theorie-Trend-Adaptive-Momentum-Strategie ist eine leistungsstarke Trendfolgemethode, die Händlern durch innovative Wendepunktanalysetechniken ein systematisches Werkzeug zur Trendidentifikation bietet. Trotz einiger inhärenter Risiken machen ihre Flexibilität und Dynamik sie zu einem wertvollen Ansatz in modernen quantitativen Trading-Strategien. Die erfolgreiche Anwendung dieser Strategie erfordert ein tiefes Verständnis ihrer Funktionsweise sowie eine kontinuierliche Optimierung und Anpassung an spezifische Marktumgebungen.
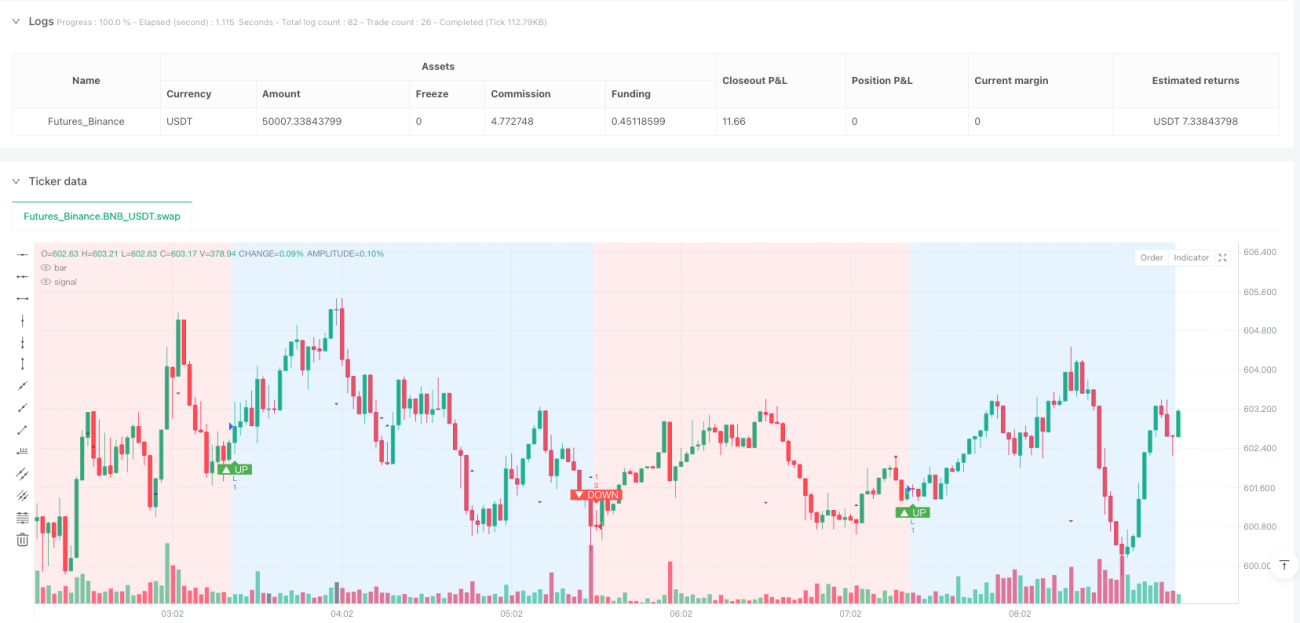
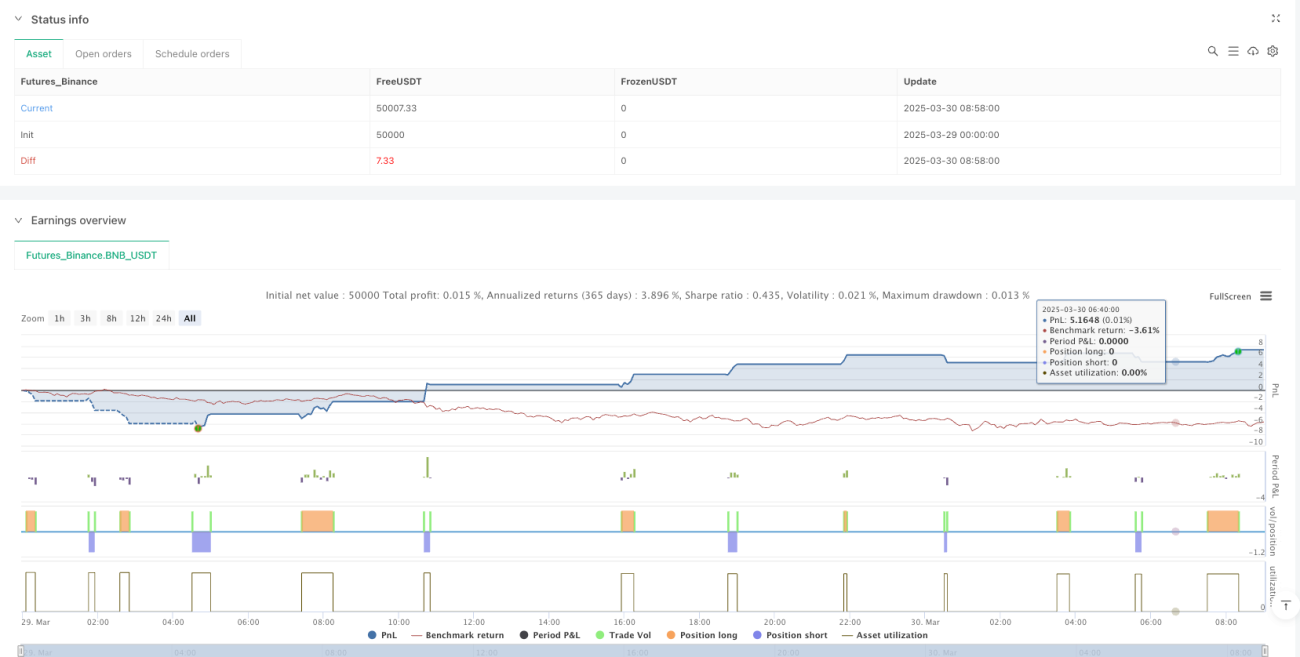
/*backtest
start: 2025-03-29 00:00:00
end: 2025-03-30 09:00:00
period: 2m
basePeriod: 2m
exchanges: [{"eid":"Futures_Binance","currency":"BNB_USDT"}]
*/

//@version=5
// strategy(title="Dow Theory Trend Strategy v3", shorttitle="Dow Trend Strat v3", overlay=true,
//      initial_capital=10000, default_qty_type=strategy.percent_of_equity, default_qty_value=10,
// commission_type=strategy.commission.percent, commission_value=0.1, // Example strategy settings with commission- 1