
Übersicht
Die Multi-Timeframe Zero-Lag Trend Signal Trading Strategy ist ein quantitatives Handelssystem, das auf dem Zero-Lag Exponential Moving Average (ZLEMA) basiert. Es zielt darauf ab, die Verzögerung herkömmlicher gleitender Durchschnitte zu reduzieren und bietet schnellere und genauere Signale zur Trendidentifikation. Die Strategie kombiniert nicht nur Volatilitätskanäle zur Erkennung von Trendänderungen, sondern integriert auch verschiedene flexible Ausstiegsmechanismen, darunter Risiko-Ertrags-Verhältnis-Ausstiege, Gewinnziel-Ausstiege, ATR-basierte Stop-Loss- und Take-Profit-Niveaus, dynamische Trailing-Stops sowie Ausstiege bei Schnittpunkten gleitender Durchschnitte. Sie eignet sich besonders für den mittel- bis langfristigen Handel und kann wahlweise nur Long oder both Long und Short konfiguriert werden. Eine Wiedereinstiegsoption auf Nulllinie erhöht die Anpassungsfähigkeit und das Risikomanagement des Handelssystems erheblich.
Strategieprinzip
Das Kernprinzip der Strategie basiert auf dem Zero-Lag Exponential Moving Average (ZLEMA), einem technischen Indikator, der die Reaktionsgeschwindigkeit gleitender Durchschnitte durch die Eliminierung oder Reduzierung von Verzögerungen in den Preisdaten verbessert. Die konkreten Implementierungsschritte sind wie folgt:
-
Zero-Lag-Berechnung: Zunächst wird der ZLEMA berechnet, und zwar mit der Formel
zlema = ta.ema(src + (src - src[lag]), length), wobeilagals die Hälfte der Länge berechnet wird. Diese Methode reduziert effektiv die Verzögerung herkömmlicher EMAs. -
Trendidentifikationsmechanismus:
- Um den ZLEMA wird ein Volatilitätskanal (ähnlich Bollinger Bändern) gebildet, dessen Breite durch den höchsten Wert des ATR multipliziert mit einem Multiplikator bestimmt wird.
- Wenn der Preis das obere Band überschreitet, wird der Trend als aufwärts (1) definiert.
- Wenn der Preis das untere Band unterschreitet, wird der Trend als abwärts (-1) definiert.
- Das System bietet außerdem eine Bestätigungsfunktion für fünf aufeinanderfolgende Kerzen mit gleichgerichteter ZLEMA-Richtung, realisiert durch die Variablen
zlemaUpTrendundzlemaDownTrend.
-
Vielfältige Einstiegsbedingungen:
- Basis-Long-Einstieg: Preis überschreitet das obere Band und liegt innerhalb des Datumsbereichs.
- Erweiterter Long-Einstieg: Basisbedingung plus Bestätigung eines anhaltenden ZLEMA-Anstiegs über fünf Kerzen.
- Short-Einstieg: Preis unterschreitet das untere Band und liegt innerhalb des Datumsbereichs (optional).
- ZLEMA-Nulllinien-Wiedereinstieg: Preis zieht sich kurzzeitig zurück, kehrt aber über den ZLEMA zurück und befindet sich weiterhin im Aufwärtstrend.
-
Umfassendes dynamisches Ausstiegssystem:
- Risiko-Ertrags-Verhältnis-Gewinnziel: Basierend auf Einstiegskurs und Stop-Loss wird ein Zielkurs für ein bestimmtes Risiko-Ertrags-Verhältnis berechnet.
- ATR-basierter Stop-Loss und Take-Profit: Dynamische Berechnung von Stop-Loss und Take-Profit unter Verwendung von ATR-Multiplikatoren.
- ATR-Trailing-Stop: Der Stop-Loss wird automatisch nach oben verschoben, wenn sich der Preis bewegt.
- Break-Even-Stop: Sobald der Gewinn ein bestimmtes Risiko-Ertrags-Verhältnis erreicht, wird der Stop-Loss auf den Einstiegskurs verschoben.
- Trendumkehr-Ausstieg: Automatischer Ausstieg, wenn der Trendindikator umschlägt.
- EMA-Ausstieg: Ausstieg, wenn der Preis einen bestimmten EMA kreuzt.
Vorteile der Strategie
Die Multi-Timeframe Zero-Lag Trend Signal Trading Strategy bietet erhebliche Vorteile:
-
Reduzierte Signalverzögerung: Durch die ZLEMA-Technologie wird die Verzögerung herkömmlicher gleitender Durchschnitte reduziert, was eine zeitnähere Trendidentifikation und ein früheres Erkennen von Trendbeginnen ermöglicht.
-
Umfassendes Risikomanagement: Mehrere Risikokontrollmechanismen sind integriert, von festen Stop-Losses über dynamische ATR-Stops und Trailing-Stops bis hin zu Break-Even-Stops, die einen umfassenden Schutz in verschiedenen Marktumgebungen bieten.
-
Flexible Handelsrichtung: Die Strategie kann wahlweise als reine Long-Strategie oder als bidirektionale Strategie konfiguriert werden, was sie an unterschiedliche Marktpräferenzen und regulatorische Anforderungen anpasst.
-
Wiedereinstiegsmechanismus: Die ZLEMA-Nulllinien-Wiedereinstiegsfunktion ermöglicht es, nach kurzen Pullbacks in starken Trends erneut einzusteigen und so die Trendgewinne zu maximieren.
-
Vielfältige Ausstiegsstrategien: Es werden verschiedene Ausstiegsoptionen für unterschiedliche Marktbedingungen bereitgestellt, sodass Gewinne entweder durch Gewinnziele fixiert oder durch Trailing-Stops gesteigert werden können.
-
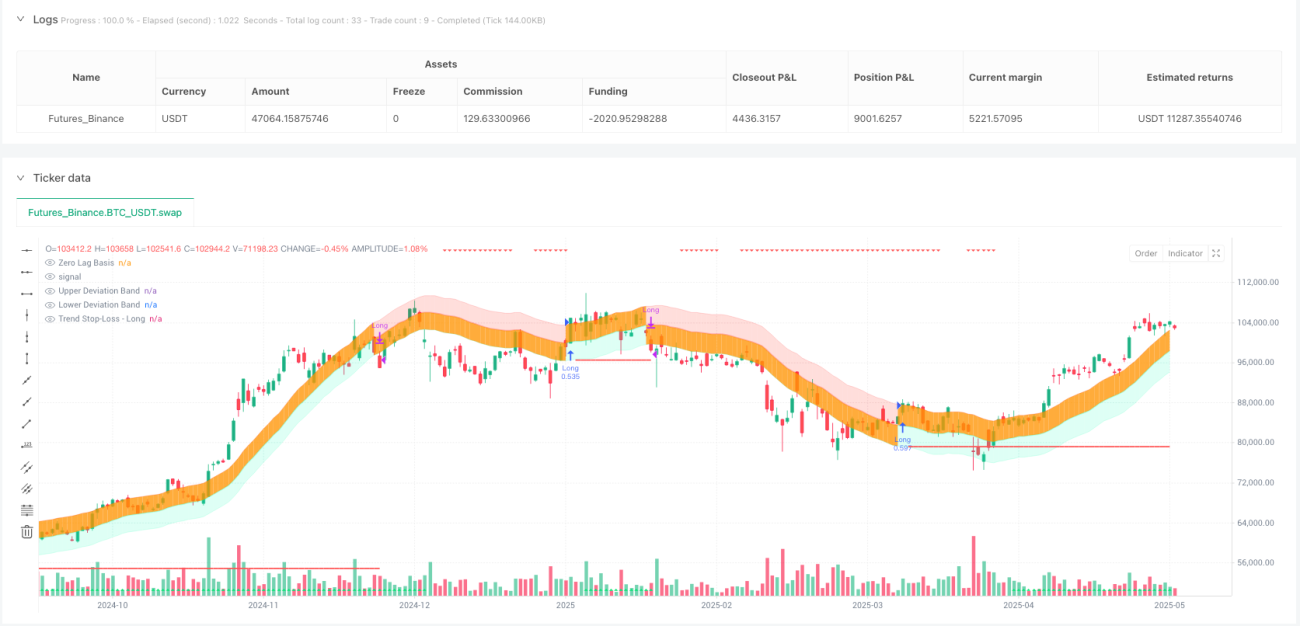
Visuelle Hilfsmittel: Durch Trendschattierungen, Stop-Loss-Linien, Take-Profit-Linien und Trendindikatoren werden Handelssignale und Risikomanagement-Positionen visuell dargestellt.
-
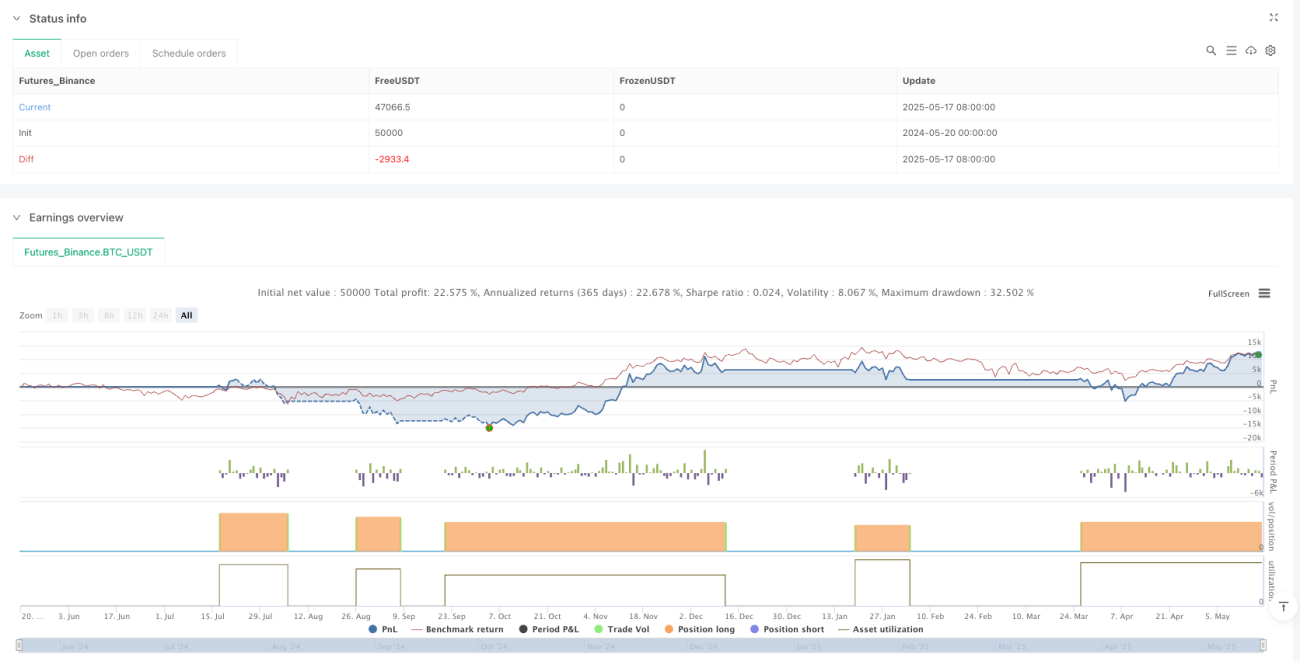
Detaillierte Leistungsstatistiken: Eine Handelsstatistik-Tabelle zeigt wichtige Kennzahlen wie Gewinnrate, Nettogewinn, maximalen Drawdown usw. und erleichtert so die Strategiebewertung und -optimierung.
Strategierisiken
Obwohl die Strategie durchdacht ist, bestehen dennoch einige potenzielle Risiken:
-
Parameterempfindlichkeit: Kernparameter wie ZLEMA-Länge und ATR-Multiplikator haben einen erheblichen Einfluss auf die Strategieleistung. Eine falsche Einstellung kann zu zu vielen oder zu wenigen Signalen führen.
-
Falsche Signale in Seitwärtsmärkten: In Märkten ohne klaren Trend können häufige Falschsignale auftreten, die zu Verlustserien führen.
-
Risiko von Trendumkehrungen: Trotz mehrerer Ausstiegsmechanismen kann es bei abrupten Trendumkehrungen zu Verzögerungen kommen, die zu erheblichen Verlusten führen.
-
Überanpassungsrisiko: Die Kombination mehrerer Parameter kann zu einer Überanpassung an historische Daten führen, was in zukünftigen Marktumgebungen zu schlechter Performance führt.
-
Seltene Signale bei langen Zeiträumen: Bei Verwendung längerer ZLEMA-Längen kann die Strategie nur wenige Handelssignale generieren, was die Kapitalnutzungseffizienz beeinträchtigt.
-
Herausforderung der Stop-Breite: ATR-basierte Stops können in volatilen Märkten zu breit sein (hoher Einzelverlust) oder in ruhigen Märkten zu eng (häufige Auslösung).
Methoden zur Risikominderung umfassen: strenge Parameter-Backtests und Vorwärtsvalidierung, Kombination mit Marktzustandsindikatoren, um den Handel in Seitwärtsmärkten zu vermeiden, strenge Geldmanagementregeln und regelmäßige Neuoptimierung der Strategieparameter, um sich an veränderte Marktbedingungen anzupassen.
Optimierungsmöglichkeiten
Die Strategie bietet mehrere Ansatzpunkte zur weiteren Leistungssteigerung:
-
Dynamische Parametereinstellung: Entwicklung adaptiver Mechanismen, die die ZLEMA-Länge und den ATR-Multiplikator automatisch an die Marktvolatilität anpassen, um die Anpassungsfähigkeit an verschiedene Marktumgebungen zu verbessern.
-
Marktzustandsfilter: Einführung von Marktzustandsindikatoren (z. B. ADX, Volatilitätsindikatoren), um nur unter günstigen Bedingungen zu handeln und häufige Fehlsignale in ineffizienten Seitwärtsmärkten zu vermeiden.
-
Bestätigung über mehrere Zeitrahmen: Kombination der Trendrichtung eines höheren Zeitrahmens, um nur bei übereinstimmender großer Trendrichtung einzusteigen, was die Erfolgsquote erhöht.
-
Volumenbestätigung: Integration von Volumenindikatoren als zusätzliche Bestätigung, z. B. nur dann, wenn das Volumen bei Trendänderungssignalen steigt.
-
Optimierung durch maschinelles Lernen: Verwendung von Algorithmen des maschinellen Lernens zur Suche nach optimalen Parameterkombinationen und Einstiegszeitpunkten, insbesondere zur Vorhersage, welche Signale wahrscheinlicher erfolgreich sind.
-
Saisonale und zeitliche Filter: Hinzufügen von Handelszeiten- und Kalenderfiltern, um ineffiziente oder risikoreiche Handelszeiten zu vermeiden.
-
Korrelationsanalyse verwandter Vermögenswerte: Einführung von Korrelationsanalysen zwischen verwandten Vermögenswerten, um die Glaubwürdigkeit von Signalen zu erhöhen, wenn mehrere Vermögenswerte in die gleiche Richtung weisen.
Diese Optimierungsrichtungen können nicht nur die Stabilität und Rentabilität der Strategie verbessern, sondern auch das Risiko verringern und sie besser an verschiedene Marktumgebungen und persönliche Risikopräferenzen anpassen.
Zusammenfassung
Die Multi-Timeframe Zero-Lag Trend Signal Trading Strategy ist ein umfassendes und flexibles quantitatives Handelssystem, das durch die Zero-Lag Exponential Moving Average (ZLEMA)-Technologie und Volatilitätskanäle eine schnelle und genaue Trendidentifikation ermöglicht und das Kapital durch ein mehrschichtiges dynamisches Risikomanagement schützt. Die Strategie kann sowohl Einstiegsmöglichkeiten zu Trendbeginn nutzen als auch durch den Wiedereinstiegsmechanismus während der Trendentwicklung Gewinne maximieren. Gleichzeitig bietet sie verschiedene Ausstiegsstrategien, die sich an unterschiedliche Marktumgebungen anpassen.
Die Hauptvorteile liegen in der reduzierten Signalverzögerung, dem umfassenden Risikomanagementsystem und den flexiblen Handelskonfigurationsoptionen. Anwender sollten jedoch potenzielle Risiken wie Parameterempfindlichkeit, falsche Signale in Seitwärtsmärkten und Überanpassung beachten. Durch Optimierungen wie Marktzustandsfilter, Bestätigung über mehrere Zeitrahmen und dynamische Parametereinstellung kann die Strategieleistung weiter verbessert werden.
Als Indikator-basiertes quantitatives Handelssystem eignet sich die Strategie besonders für den mittel- bis langfristigen Trendhandel in verschiedenen Finanzmärkten. Allerdings sollte jede Strategie an die individuellen Handelsziele, die Risikotoleranz und die Marktpräferenzen angepasst sowie unter strengen Geldmanagementregeln im praktischen Handel angewendet werden.
//@version=6
// Quant Trading Pro www.quanttradingpro.com
// #1 Strategy Optimizer on the chrome extension store Quant Trading Strategy Optimizer


strategy(title="Quant Trading Zero Lag Trend Signals (MTF) Strategy", shorttitle="QT0️⃣Zero Lag Signals Strategy", overlay=true,
     commission_type=strategy.commission.percent,
     commission_value=0.1,
     slippage=3,
     default_qty_type=strategy.percent_of_equity,
     default_qty_value=100,
initial_capital=1000, - 1