Mehrstufiges Fibonacci-Trendverfolgungs- und Hedging-Handelsstrategiesystem

EMA ATR ADX DMI FIBONACCI SUPPORT RESISTANCE HEDGE VOLUME
Erstellungsdatum: 2025-05-26 13:15:16 zuletzt geändert: 2025-08-20 15:52:36
Kopie: 0 Klicks: 339
2
konzentrieren Sie sich auf
319
Anhänger

Mehrstufiges Fibonacci-Trendverfolgungs- und Hedging-Handelsstrategiesystem Mehrstufiges Fibonacci-Trendverfolgungs- und Hedging-Handelsstrategiesystem

[tran]

Überblick

Die Multi-Level Fibonacci-Trend-Tracking- und Hedging-Trading-Strategie-System ist eine umfassende quantitative Trading-Strategie, die mehrere technische Analyse-Indikatoren integriert. Die Strategie basiert auf der Fibonacci-Retracement-Theorie und kombiniert mehrere technische Indikatoren wie den Index Moving Average (EMA), die Average True Rate (ATR), den Average Trend Index (ADX) und den Richtungsbewegungsindikator (DMI) zu einem mehrdimensionalen Marktanalyse-Framework. Die Strategie verfügt nicht nur über die traditionellen Trend-Tracking-Funktionen, sondern auch über eine integrierte Bounce-Trading-Mechanismus und Bremsen, um unter verschiedenen Märkten Gewinnchancen zu erfassen und Risiken effektiv zu kontrollieren.

Die Strategie ist einzigartig durch ihre mehrschichtige Risikomanagement-System und flexible Handelsmodell. Durch die Einrichtung von mehreren Stop-Ziel (TP1 und TP2) und ATR-basierte dynamische Stop-Loss-Mechanismen, die Strategie ist in der Lage, die Ertragspotenzial zu maximieren, während das Kapital zu schützen.

Strategieprinzip

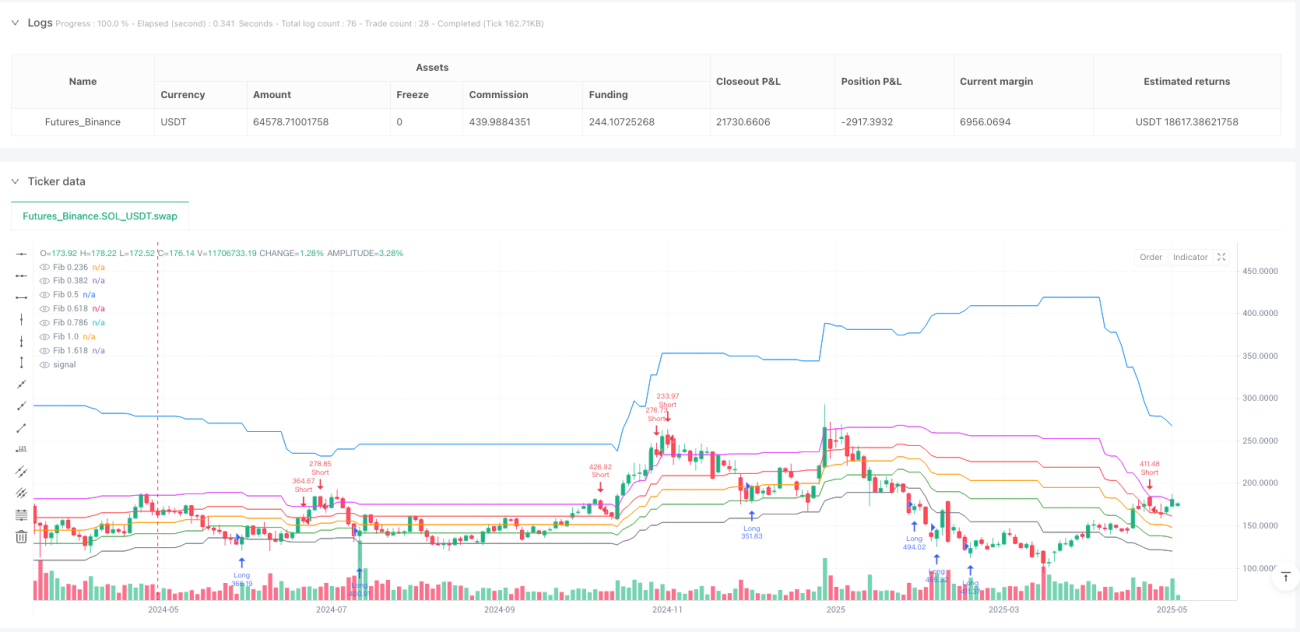
Die Kernlogik der Strategie basiert auf einer Kombination aus Fibonacci-Rückgangstheorie und Trendanalyse. Zunächst wird die Strategie durch die Berechnung von Höhen und Tiefen in einem bestimmten Zeitraum ermittelt, um die Fibonacci-Rückgangsebenen zu ermitteln, einschließlich der Schlüsselpositionen 23.6%, 38.2%, 50%, 61.8%, 78.6%, 100% und 161.8%. Diese Werte werden als wichtige Unterstützungs- und Widerstandspunkte verwendet und bieten eine wichtige Referenz für die Erzeugung von Handelssignalen.

Die Strategie verwendet den 50-Perioden-Index-Moving-Average als Haupttrend-Ermittlungstool. Wenn der Preis über drei aufeinanderfolgenden K-Linien der EMA liegt, wird er als Aufwärtstrend bezeichnet; das Gegenteil ist ein Abwärtstrend. Gleichzeitig analysiert die Strategie die Preisstruktur, um eine Mehrkopfstruktur zu bestätigen, indem sie höhere Tiefs und höhere Höhen identifiziert, und eine Hohlkopfstruktur durch niedrigere Höhen und niedrigere Tiefs bestätigt.

Die Einführung von ADX- und DMI-Indikatoren erhöht die Präzision bei der Beurteilung der Trendstärke. ADX-Werte von mehr als 20 werden als Maßstab für starke Trends angesehen, während die relative Stärke von + DI und -DI zur Bestimmung der Richtung der Trends verwendet wird. Die Umsatzanalyse ist auch ein wichtiger Bestandteil der Strategie und wird als wirksame Mengenbestätigung angesehen, wenn der Umsatz mehr als das 1,2-fache des 20-Perioden-Durchschnitts beträgt.

Die Generierung von Handelssignalen erfordert die gleichzeitige Erfüllung mehrerer Bedingungen: die Richtung des Trends ist klar, der Preis ist nahe am kritischen Fibonacci-Niveau, die Trendstärke ist ausreichend, die Richtungsanzeige wird bestätigt und die Handelsmenge wird erhöht. Diese Mehrfachfilterung erhöht die Signalzuverlässigkeit erheblich und reduziert die Wahrscheinlichkeit von Falschsignalen.

Strategische Vorteile

Die Strategie hat mehrere bedeutende Vorteile, die sich vor allem in ihrem umfassenden technischen Analyse-Framework widerspiegeln. Durch die Integration von Fibonacci-Theorie, Trendanalyse, Dynamikindikatoren und Transaktionsvolumenanalyse kann die Strategie die Marktsituation aus mehreren Dimensionen bewerten und ein umfassenderes und genaueres Handelssignal liefern. Diese Methode der Integration von mehreren Indikatoren reduziert effektiv die irreführenden Signale, die ein einzelner Indikator erzeugen kann, und erhöht die Stabilität und Zuverlässigkeit der Gesamtstrategie.
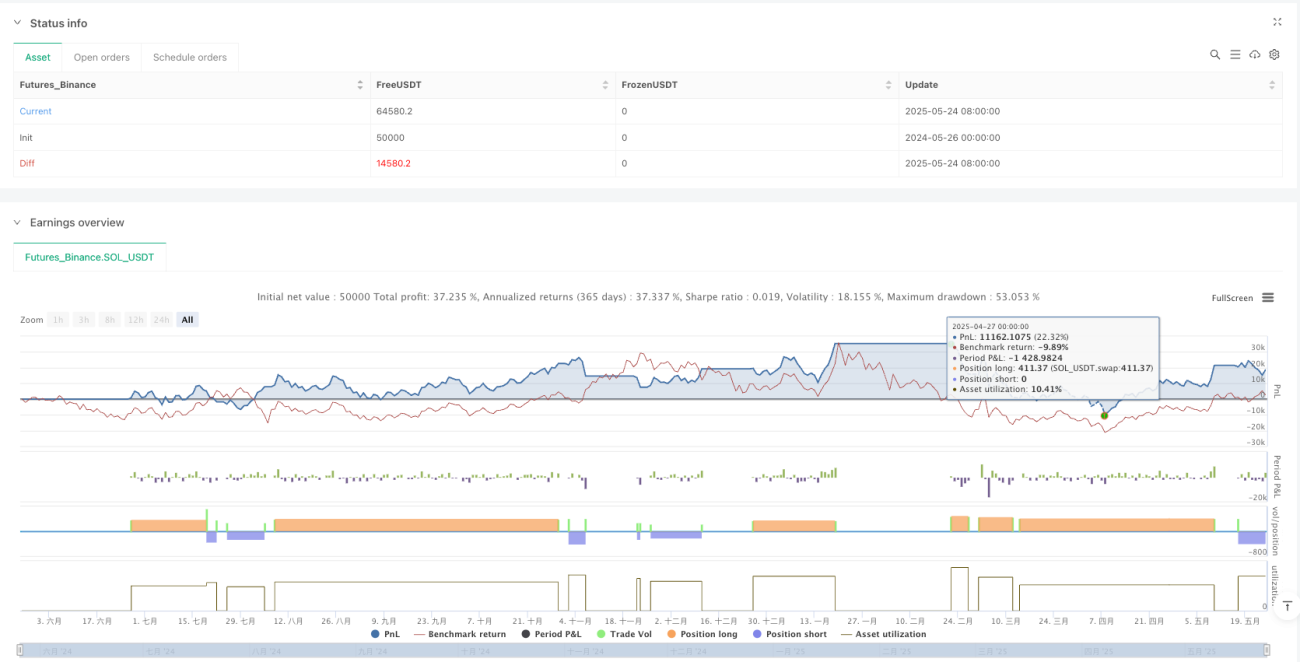
Das Risiko-Management-System der Strategie ist ein weiterer großer Vorteil. Die Doppelstop-Mechanismen ermöglichen es dem Händler, einen Teil der Gewinne bei Erreichen des ersten Ziels zu sperren, während die verbleibenden Positionen für größere Gewinne gehalten werden. Die dynamische Stop-Loss-Einstellung basierend auf ATR kann die Risikokontrolle automatisch an die Marktvolatilität anpassen.

Die Rebound-Trading-Funktion erhöht die Gewinnchancen für Strategien. Die Strategie ist in der Lage, diese kurzfristigen Umkehrungen schnell zu erkennen und sich an ihnen zu beteiligen, wenn der Preis an wichtigen Unterstützungs- oder Widerstandspunkten zurückschlägt, wodurch mehr Handelsmöglichkeiten auf der Grundlage von Trendhandel geschaffen werden. Diese Flexibilität ermöglicht es der Strategie, sich an unterschiedliche Marktbedingungen anzupassen und sowohl in starken Trendmärkten als auch in zwischenstaatlichen Schwankungen passende Handelsmöglichkeiten zu finden.

Die Integration von Hedging-Funktionen ist ein innovatives Merkmal der Strategie. Wenn ein Leerlaufsignal beim Halten von mehreren Positionen auftritt, wird die Strategie zur Absicherung von Leerlaufpositionen eingesetzt; und umgekehrt. Dieser Mechanismus bietet zusätzlichen Schutz bei schnellen Marktausflügen, verringert potenzielle Verluste und kann sich in neue Gewinnchancen umwandeln.

Die Einstellung eines Zeitfilters verhindert Übertrading. Die Strategie vermeidet häufige Positionseröffnungen in kurzer Zeit, reduziert die Transaktionskosten und verbessert die Signalqualität, indem mindestens 5 K-Linien zwischen aufeinanderfolgenden Signalen angefordert werden.

Strategisches Risiko

Obwohl die Strategie viele Vorteile hat, gibt es einige Risikofaktoren, die zu beachten sind. Zuerst ist das Risiko der Parameterabhängigkeit. Die Strategie beinhaltet mehrere Parameter-Einstellungen, einschließlich der Fibonacci-Zyklus, Toleranz, ATR-Multiplikatoren usw. Die Auswahl dieser Parameter hat einen wichtigen Einfluss auf die Strategie-Performance.

Eine weitere potenzielle Gefahr ist die Anpassungsfähigkeit des Marktumfelds. Strategien, die hauptsächlich auf technischen Analysen basieren, können unter bestimmten Marktbedingungen schlecht abschneiden, z. B. bei stark einseitigen, fundamentaldriven Verhaltensweisen, bei denen technische Indikatoren fehlschlagen können. Darüber hinaus können sowohl die Signalfrequenz als auch die Genauigkeit der Strategie in einem sehr schwachen oder sehr schwachen Marktumfeld beeinträchtigt werden.

Die Kosten für die Ausführung von Aufträgen können die theoretischen Erträge einer Strategie beeinträchtigen, insbesondere für Strategien mit hoher Häufigkeit des Handels.

Die Absicherung bietet zwar zusätzlichen Schutz, erhöht jedoch die Komplexität der Strategie. In einigen Fällen können Absicherungsoperationen zu gleichzeitigen Verlusten bei offenen Positionen oder zu zusätzlichen Kosten in Bezug auf Gebühren führen. Daher ist es notwendig, die tatsächliche Wirksamkeit der Absicherung sorgfältig zu bewerten und zu prüfen, ob sie unter bestimmten Marktbedingungen aktiviert wird.

Richtung der Strategieoptimierung

Um die Performance der Strategie weiter zu verbessern, kann aus mehreren Richtungen optimiert werden. Zuerst ist die Einführung eines Dynamikanpassungsmechanismus möglich. Wichtige Parameter wie die Fibonacci-Zyklus, die ATR-Multiplikatoren können dynamisch an die Marktvolatilität, die Trendstärke und andere Faktoren angepasst werden.

Die Integration von Machine-Learning-Technologien ist eine weitere wichtige Optimierungsrichtung. Machine-Learning-Algorithmen können verwendet werden, um die optimale Einstiegsmomente zu identifizieren oder die optimale Konfiguration basierend auf einer Parameterkombination aus historischen Daten zu erlernen. Darüber hinaus können Technologien der natürlichen Sprache verwendet werden, um die Auswirkungen von Marktemotionen und Nachrichtenereignissen auf die Preise zu analysieren und so eine grundlegende Analyse für die Strategie zu erweitern.

Die Integration von Multi-Time-Frame-Analysen ermöglicht eine umfassendere Marktsicht. Es ist möglich, die Richtung der großen Trends auf längeren Zeiträumen zu bestätigen und die genauen Eintrittspunkte auf kürzeren Zeiträumen zu finden. Diese koordinierte Analyse von Multi-Time-Frame-Analysen verbessert die Signalqualität und verringert das Risiko von Gegenhandelsgeschäften.

Die Optimierung des Kapitalmanagements ist auch ein wichtiger Weg, um die Strategie zu verbessern. Die Positionsgröße kann dynamisch an die Marktbedingungen und die Strategievertrauen angepasst werden. Zum Beispiel kann die Position bei hohem Vertrauen erhöht und bei niedrigem Vertrauen reduziert werden. Darüber hinaus kann ein Maximal-Retreat-Kontrollmechanismus eingeführt werden, der die Position automatisch reduziert oder den Handel aussetzt, wenn die Strategie große Verluste verursacht.

Eine weitere Verfeinerung der Stop-Loss-Logik ist ebenfalls zu berücksichtigen. Es kann ein Stop-Loss-Tracking-Mechanismus eingeführt werden, der die Stop-Loss-Position an die Preisentwicklung anpasst, um mehr Profite zu sichern. Gleichzeitig kann ein intelligenter Stop-Target basierend auf marktstrukturierten Merkmalen festgelegt werden, z. B. ein früherer Stop in der Nähe von kritischen Widerstandspunkten.

Zusammenfassen

Die Multi-Level-Fibonacci-Trend-Tracking- und Hedging-Trading-Strategie-System repräsentiert eine wichtige Entwicklungsrichtung der modernen Quantitative Trading-Technologie. Die Strategie baut durch die geschickte Integration mehrerer klassischer technischer Analyse-Tools ein robustes und flexibles Trading-Framework auf.

Die erfolgreiche Umsetzung einer Strategie erfordert ein umfassendes Verständnis ihrer Grundprinzipien und Funktionsmechanismen und die entsprechende Anpassung und Optimierung der Parameter an das jeweilige Handelsumfeld. Obwohl die Strategie theoretisch gut konzipiert ist, müssen die Auswirkungen von realen Faktoren wie der Marktmikrostruktur, den Transaktionskosten und den Gleitpunkten in der praktischen Anwendung berücksichtigt werden.

Mit der Weiterentwicklung von KI- und maschinellen Lerntechnologien gibt es noch viel Optimierungsraum für diese Strategie. Die Leistung der Strategie wird durch die Einführung fortschrittlicherer Datenanalyse-Technologien und Anpassungsmechanismen weiter verbessert. Für quantitative Händler bieten solche integrierten Strategien eine wertvolle Lern- und Verbesserungsplattform, die zu einem tieferen Verständnis der Marktdynamik und der Bedeutung des Risikomanagements beiträgt. ||

Overview

The Multi-Level Fibonacci Trend Following and Hedging Trading Strategy System is a comprehensive quantitative trading strategy that integrates multiple technical analysis indicators. This strategy centers on Fibonacci retracement theory, combining Exponential Moving Average (EMA), Average True Range (ATR), Average Directional Index (ADX), and Directional Movement Indicator (DMI) to construct a multi-dimensional market analysis framework. The strategy not only features traditional trend-following capabilities but also integrates bounce trading mechanisms and hedging functionality, aiming to capture profitable opportunities under different market conditions while effectively controlling risk.

The unique aspect of this strategy lies in its multi-layered risk management system and flexible trading modes. By setting multiple take-profit targets (TP1 and TP2) and dynamic stop-loss mechanisms based on ATR, the strategy can maximize profit potential while protecting capital. Additionally, the built-in hedging function adds an extra risk buffer to the strategy, enabling it to maintain relatively stable performance even in highly volatile market environments.

Strategy Principles

The core logic of the strategy is based on the combination of Fibonacci retracement theory and trend analysis. First, the strategy calculates the highest and lowest points within a specified period to determine Fibonacci retracement levels, including key positions at 23.6%, 38.2%, 50%, 61.8%, 78.6%, 100%, and 161.8%. These levels serve as important support and resistance zones, providing crucial references for trading signal generation.

For trend identification, the strategy employs a 50-period Exponential Moving Average as the primary trend determination tool. When prices remain above the EMA for three consecutive candlesticks, it’s identified as an uptrend; conversely, it’s considered a downtrend. Simultaneously, the strategy analyzes price structure by identifying higher lows and higher highs to confirm bullish structure, and lower highs and lower lows to confirm bearish structure.

The introduction of ADX and DMI indicators enhances the precision of trend strength assessment. An ADX value greater than 20 is considered the standard for a strong trend, while the relative strength of +DI and -DI is used to determine trend direction. Volume analysis is also an important component of the strategy, where volume exceeding 1.2 times the 20-period average is considered effective volume confirmation.

Trade signal generation requires multiple conditions to be met simultaneously: clear trend direction, price proximity to key Fibonacci levels, sufficient trend strength, directional indicator confirmation, and volume expansion. This multi-filter mechanism significantly improves signal reliability and reduces the probability of false signals.

Strategy Advantages

This strategy possesses multiple significant advantages, first manifested in its comprehensive technical analysis framework. By integrating Fibonacci theory, trend analysis, momentum indicators, and volume analysis, the strategy can evaluate market conditions from multiple dimensions, providing more comprehensive and accurate trading signals. This multi-indicator fusion approach effectively reduces misleading signals that might be generated by single indicators, improving the overall stability and reliability of the strategy.

The strategy’s risk management system represents another major advantage. The dual take-profit mechanism allows traders to lock in partial profits upon reaching the first target while maintaining remaining positions to pursue greater returns. ATR-based dynamic stop-loss settings can automatically adjust risk control levels according to market volatility, tightening stops during low volatility to protect profits and relaxing stops during high volatility to avoid being stopped out by normal fluctuations.

The bounce trading functionality adds additional profit opportunities to the strategy. When prices bounce at key support or resistance levels, the strategy can quickly identify and participate in such short-term reversal movements, thereby adding more trading opportunities beyond trend trading. This flexibility enables the strategy to adapt to different market conditions, finding suitable trading opportunities whether in strong trending markets or range-bound markets.

The integration of hedging functionality is an innovative feature of this strategy. When holding long positions and a short signal appears, the strategy will open a hedge short position; vice versa. This mechanism can provide additional protection during rapid market reversals, reducing potential losses and possibly converting them into new profit opportunities.

The time filter setting prevents overtrading issues. By requiring at least 5 candlesticks between consecutive signals, the strategy avoids frequent position opening within short periods, reducing trading costs and improving signal quality.

Strategy Risks

Despite the strategy’s multiple advantages, several risk factors require attention. First is parameter dependency risk. The strategy involves multiple parameter settings, including Fibonacci period, tolerance, ATR multipliers, etc. The selection of these parameters significantly impacts strategy performance. Inappropriate parameter settings may lead to overfitting historical data or poor performance in actual markets. Therefore, sufficient backtesting and parameter optimization are needed to find the most suitable parameter combinations for specific markets and timeframes.

Market environment adaptability represents another potential risk. The strategy is primarily based on technical analysis and may underperform in certain market conditions, such as during fundamental-driven strong unidirectional moves where technical indicators might fail. Additionally, in extremely low or high volatility market environments, both signal generation frequency and accuracy may be affected.

Slippage and execution risks also need consideration. In actual trading, particularly during high volatility market conditions, there may be differences between order execution prices and expected prices. This slippage cost could erode the strategy’s theoretical returns, especially for frequently trading strategies.

While the hedging function provides additional protection, it also increases strategy complexity. In certain situations, hedging operations might result in simultaneous losses on both long and short positions, or generate additional costs in terms of commissions. Therefore, careful evaluation of the hedging function’s actual effectiveness is needed, along with consideration of whether to enable this function under specific market conditions.

Strategy Optimization Directions

To further enhance strategy performance, optimization can be pursued in multiple directions. First is the introduction of dynamic parameter adjustment mechanisms. Key parameters such as Fibonacci period and ATR multipliers can be dynamically adjusted based on market volatility, trend strength, and other factors. For example, increasing ATR multipliers in high volatility markets to provide larger stop-loss space, and decreasing ATR multipliers in low volatility markets to tighten risk control.

Integration of machine learning technology represents another important optimization direction. Machine learning algorithms can be used to identify optimal entry timing or learn optimal parameter combination configurations based on historical data. Additionally, natural language processing technology can be utilized to analyze market sentiment and news event impacts on prices, adding fundamental analysis dimensions to the strategy.

Integration of multi-timeframe analysis can provide a more comprehensive market perspective. Larger timeframes can be used to confirm major trend direction, while shorter timeframes can be used to find precise entry points. This coordinated multi-timeframe analysis can improve signal quality and reduce counter-trend trading risks.

Money management optimization is also an important avenue for enhancing strategy performance. Position sizes can be dynamically adjusted based on market conditions, strategy confidence levels, and other factors. For example, increasing positions during high-confidence signals and reducing positions during low-confidence signals. Additionally, maximum drawdown control mechanisms can be introduced to automatically reduce positions or pause trading when the strategy experiences significant losses.

Further refinement of take-profit and stop-loss logic is also worth considering. Trailing stop mechanisms can be introduced to dynamically adjust stop-loss positions based on price movements to lock in more profits. Simultaneously, more intelligent take-profit targets can be set based on market structure characteristics, such as taking profits early near key resistance levels.

Conclusion

The Multi-Level Fibonacci Trend Following and Hedging Trading Strategy System represents an important development direction in modern quantitative trading technology. This strategy cleverly integrates multiple classic technical analysis tools to construct a trading framework that is both robust and flexible. Its multi-filter mechanism ensures signal quality, the multi-layered risk management system provides effective capital protection, and the hedging function adds an additional safety margin to the strategy.

Successful implementation of this strategy requires thorough understanding of its fundamental principles and operational mechanisms, along with appropriate parameter adjustments and optimizations based on specific trading environments. While the strategy has excellent theoretical design, practical application still requires consideration of real-world factors such as market microstructure, trading costs, and slippage.

With the continuous development of artificial intelligence and machine learning technologies, this strategy still has enormous optimization potential. Through the introduction of more advanced data analysis techniques and adaptive mechanisms, strategy performance is expected to be further enhanced. For quantitative traders, such comprehensive strategies provide a valuable learning and improvement platform, helping to deepen understanding of market dynamics and the importance of risk management.[/trans]

Strategiequellcode
/*backtest
start: 2024-05-26 00:00:00
end: 2025-05-25 00:00:00
period: 2d
basePeriod: 2d
exchanges: [{"eid":"Futures_Binance","currency":"SOL_USDT"}]
*/

//@version=5
strategy("Fibonacci Trend v6.4 - TP/SL Labels", overlay=true, default_qty_type=strategy.percent_of_equity, default_qty_value=100)

// === Parameters ===
fibLen     = input.int(50, "Fibonacci Range")
fibTol     = input.float(0.01, "Fib Proximity Tolerance (%)", step=0.001)
slMult     = input.float(1.5, "SL - ATR", step=0.1)
tp2Mult    = input.float(2.0, "TP2 - ATR", step=0.1)
srLookback = input.int(20, "Support/Resistance Lookback Bars")
useBounce  = input.bool(true, "Enable Bounce Entry")

// === Indicators ===
ema50   = ta.ema(close, 50)
atr     = ta.atr(14)
volAvg  = ta.sma(volume, 20)
volHigh = volume > volAvg * 1.2

// === Fibonacci Levels ===
lowWick   = ta.lowest(low, fibLen)
highWick  = ta.highest(high, fibLen)
rangeWick = highWick - lowWick

fib236  = lowWick + 0.236 * rangeWick
fib382  = lowWick + 0.382 * rangeWick
fib5    = lowWick + 0.5   * rangeWick
fib618  = lowWick + 0.618 * rangeWick
fib786  = lowWick + 0.786 * rangeWick
fib1    = highWick
fib1618 = lowWick + 1.618 * rangeWick

nearSupport = math.abs(low - fib382)/close < fibTol or math.abs(low - fib5)/close < fibTol
nearResist  = math.abs(high - fib618)/close < fibTol

// === Trend Structure ===
higherLow   = low > low[1] and low[1] > low[2]
higherHigh  = high > high[1]
lowerHigh   = high < high[1] and high[1] < high[2]
lowerLow    = low < low[1]
longStruct  = higherLow and higherHigh
shortStruct = lowerHigh and lowerLow

// === ADX / DMI ===
dmiLen   = 14
upMove   = high - high[1]
downMove = low[1] - low
plusDM   = (upMove > downMove and upMove > 0) ? upMove : 0
minusDM  = (downMove > upMove and downMove > 0) ? downMove : 0
tr       = ta.tr(true)
tr14     = ta.rma(tr, dmiLen)
plusDI   = 100 * ta.rma(plusDM, dmiLen) / tr14
minusDI  = 100 * ta.rma(minusDM, dmiLen) / tr14
dx       = 100 * math.abs(plusDI - minusDI) / (plusDI + minusDI)
adx      = ta.rma(dx, dmiLen)
trendStrong = adx > 20

// === EMA Momentum Break ===
emaBreakLong  = close > ema50 and close[1] < ema50 and volume > volAvg
emaBreakShort = close < ema50 and close[1] > ema50 and volume > volAvg

// === Time Filter ===
var int lastLongBar = na
var int lastShortBar = na
canLong  = na(lastLongBar) or (bar_index - lastLongBar > 5)
canShort = na(lastShortBar) or (bar_index - lastShortBar > 5)

priceAboveEMA = close > ema50 and close[1] > ema50 and close[2] > ema50
priceBelowEMA = close < ema50 and close[1] < ema50 and close[2] < ema50

// === Support / Resistance ===
support = ta.lowest(low, srLookback)
resist  = ta.highest(high, srLookback)

// === Entry Conditions ===
longTrend  = priceAboveEMA and nearSupport and trendStrong and plusDI > minusDI and longStruct and (volHigh or emaBreakLong) and canLong
shortTrend = priceBelowEMA and nearResist  and trendStrong and minusDI > plusDI and shortStruct and (volHigh or emaBreakShort) and canShort

bounceLong  = useBounce and math.abs(low - support)/close < fibTol and close > open and close > close[1]
bounceShort = useBounce and math.abs(high - resist)/close < fibTol and close < open and close < close[1]

longSignal  = longTrend or bounceLong
shortSignal = shortTrend or bounceShort

// === TP/SL Calculations ===
tp1Long  = resist
tp2Long  = close + atr * tp2Mult
slLong   = close - atr * slMult

tp1Short = support
tp2Short = close - atr * tp2Mult
slShort  = close + atr * slMult

tp1ColorLong  = bounceLong  ? color.blue : color.yellow
tp1ColorShort = bounceShort ? color.blue : color.yellow

// === Long Entry ===
if (longSignal and strategy.position_size <= 0)
    strategy.entry("Long", strategy.long)
    strategy.exit("TP1", from_entry="Long", limit=tp1Long, stop=slLong, qty_percent=50)
    strategy.exit("TP2", from_entry="Long", limit=tp2Long, stop=slLong)
    lastLongBar := bar_index
    label.new(bar_index, close, text="ENTRY: " + str.tostring(close, "#.##"), style=label.style_label_down, color=color.green, textcolor=color.white)
    label.new(bar_index, tp1Long, text="TP1: " + str.tostring(tp1Long, "#.##"), style=label.style_label_down, color=tp1ColorLong)
    label.new(bar_index, tp2Long, text="TP2: " + str.tostring(tp2Long, "#.##"), style=label.style_label_down, color=color.green)
    label.new(bar_index, slLong,  text="SL: "  + str.tostring(slLong, "#.##"),  style=label.style_label_up, color=color.red)

// === Short Entry ===
if (shortSignal and strategy.position_size >= 0)
    strategy.entry("Short", strategy.short)
    strategy.exit("TP1", from_entry="Short", limit=tp1Short, stop=slShort, qty_percent=50)
    strategy.exit("TP2", from_entry="Short", limit=tp2Short, stop=slShort)
    lastShortBar := bar_index
    label.new(bar_index, close, text="ENTRY: " + str.tostring(close, "#.##"), style=label.style_label_up, color=color.red, textcolor=color.white)
    label.new(bar_index, tp1Short, text="TP1: " + str.tostring(tp1Short, "#.##"), style=label.style_label_up, color=tp1ColorShort)
    label.new(bar_index, tp2Short, text="TP2: " + str.tostring(tp2Short, "#.##"), style=label.style_label_up, color=color.green)
    label.new(bar_index, slShort,  text="SL: "  + str.tostring(slShort, "#.##"),  style=label.style_label_down, color=color.red)

// === Hedge Orders ===
if (strategy.position_size > 0 and shortSignal)
    strategy.entry("HedgeShort", strategy.short)

if (strategy.position_size < 0 and longSignal)
    strategy.entry("HedgeLong", strategy.long)

// === Fibonacci Plotting ===
plot(fib236,  "Fib 0.236",  color=color.gray)
plot(fib382,  "Fib 0.382",  color=color.green)
plot(fib5,    "Fib 0.5",    color=color.orange)
plot(fib618,  "Fib 0.618",  color=color.red)
plot(fib786,  "Fib 0.786",  color=color.fuchsia)
plot(fib1,    "Fib 1.0",    color=color.white)
plot(fib1618, "Fib 1.618",  color=color.blue)