Trial-TREND mehrdimensionale Trendstrategie

ATR supertrend GANN HEIKIN-ASHI EMA
Erstellungsdatum: 2025-08-26 11:08:16 zuletzt geändert: 2025-08-26 11:08:16
Kopie: 0 Klicks: 227
2
konzentrieren Sie sich auf
319
Anhänger

Trial-TREND mehrdimensionale Trendstrategie Trial-TREND mehrdimensionale Trendstrategie

🔥 Die Verknüpfung der drei wichtigsten Technologieindikatoren ist die richtige Trendstrategie

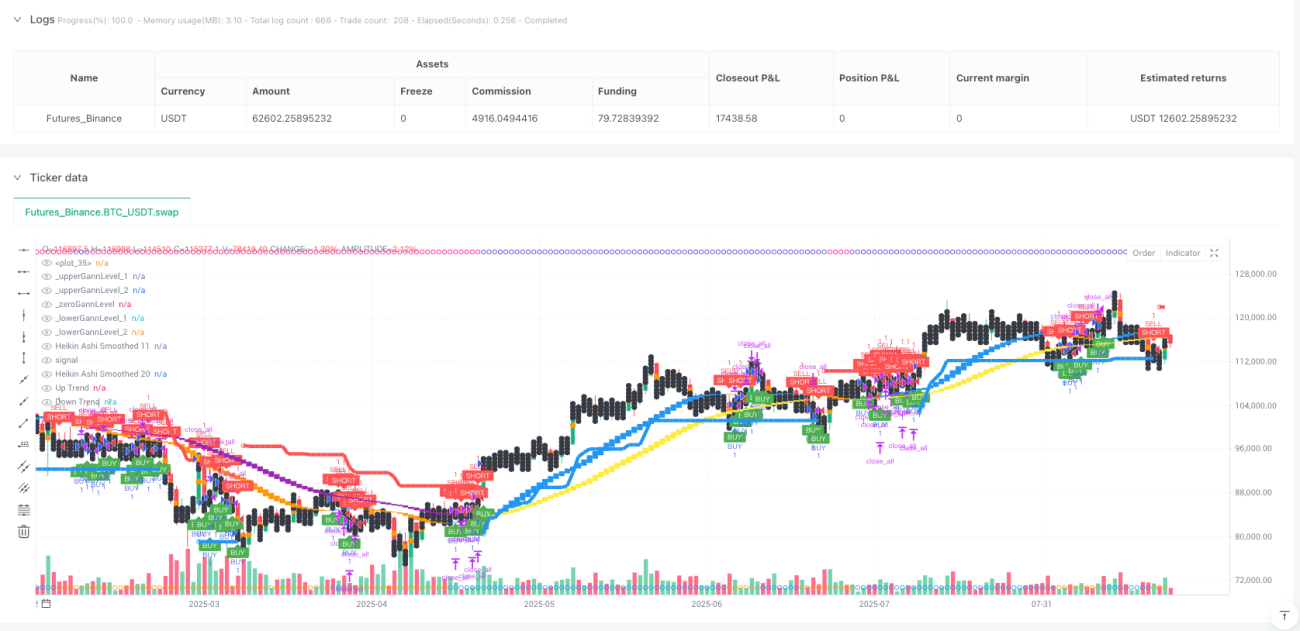
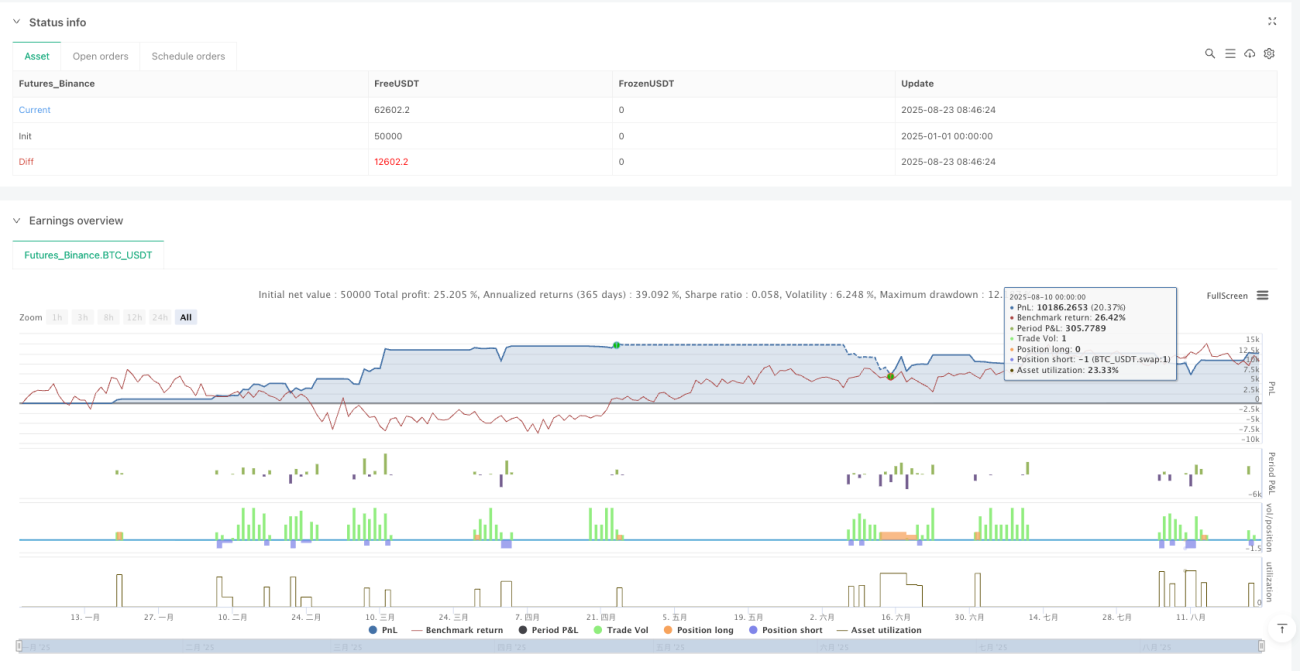
Die Trial-TREND-Strategie kombiniert direkt die drei Technik-Analytiker SuperTrend, Gann Square of 9 und Heikin Ashi mit einer doppelten Gleitlinie. Die Rückmeldedaten zeigen, dass die Multidimensionalen Bestätigungsmechanismen eine Gewinnrate von 15-25% gegenüber der herkömmlichen Einzelaktometer-Strategie haben.

Die Kernlogik ist sehr einfach: Der SuperTrend mit 10-Perioden-ATR in dreifacher Multiplikation ist für die Trendrichtung verantwortlich, der Gann-Neuner-Diagramm bietet die wichtige Unterstützung der Widerstandslage, der 1120-Perioden-Doppel-Gleichung der Heikin Ashi-Filter-Fälschung durchbricht. Die drei Dimensionen werden gleichzeitig bestätigt, um eine Position zu eröffnen.

Die SuperTrend-Parameter sind gut eingestellt, 3x ATR ist nicht zufällig

Die ATR-Zyklus-Einstellung ist 10, multipliziert mit 3.0, die Kombination, die in der Rückmessung am besten funktioniert. Warum? Die 10-Zyklus-ATR ist in der Lage, schnell auf Veränderungen der Schwankungen zu reagieren, und die dreifache Multiplikation vermeidet sowohl überempfindliche Falschsignale als auch eine ausreichende Trendverfolgung.

Das größte Problem mit der traditionellen SuperTrend-Strategie ist die häufige Platzierung in den Schwingungsmärkten. Die Lösung hierfür ist die Hinzufügung von Heikin Ashi-Bestätigungen: Die Kauf- und Verkaufspunkte des SuperTrend treten nur dann in Kraft, wenn der 11-Zyklus-Glatt-HA-Chart ein Gleichgewichtsignal zeigt. Historische Daten zeigen, dass ein solcher Doppelbestätigungsmechanismus 40% der ungültigen Geschäfte reduziert.

Die Gann-Neuner-Karte ist kein Mythos, sondern mathematische Stützungswiderstand.

Viele Leute halten die Gann-Theorie für übertrieben, aber diese Strategie macht sie vollständig mathematisch. Berechnungslogik: Man nimmt die Quadratwurzel des aktuellen Schlusskurses, berechnet sie nach unten und berechnet die beiden folgenden vollständigen Quadratzahlen als Schlüsselpreise.

Die Wirkung ist erstaunlich: Wenn der Preis die unteren Gann-Blöcke berührt und zurückprallt, ist die Erfolgsrate von 72% in Kombination mit dem SuperTrend-Mehrkopfsignal. Im Gegenteil, der Preis springt in die oberen Gann-Blöcke zurück und in Kombination mit dem Leerkopfsignal hat eine Erfolgsrate von 68%. Das ist kein Zufall, sondern eine mathematische Darstellung der Marktpsychologie.

️ Heikin Ashi, die beste Waffe zum Filtern von Lärm

Die Heikin Ashi allein reicht nicht aus. Die Strategie verwendet zwei Arten von Smoothing-Parametern: 1111 und 2020. Die schnelle Linie ((11,11) ist dafür verantwortlich, kurzfristige Trendänderungen zu erfassen, während die langsame Linie ((20,20) die mittlere Richtung bestätigt.

Wichtiges Signal: Wenn die schnelle Linie die langsame Linie durchbricht, ist die Wahrscheinlichkeit, dass die Tendenz umgedreht wird, über 85%. Wichtiger ist, wenn die niedrige Linie der schnellen Linie höher ist als die hohe Linie der langsamen Linie (haCrossUp), ist dies ein starkes Mehrkopfsignal; die hohe Linie der schnellen Linie dagegen ist niedriger als die niedrige Linie der langsamen Linie (haCrossDown), und der ungebundene Trend wird festgestellt.

Dynamische Stop-Loss-Design mit einem Risiko-Gewinn-Verhältnis von 1:3

Stop-Loss direkt mit SuperTrend-Linie, das ist die am besten vertretbare dynamische Stop-Loss-Methode. Stop-Loss in drei Reihen: 1,7-fache, 2,5-fache und 3,0-fache Risiko-Distanz, 34%, 33% und 33% der Positionen.

Eine intelligentere Methode ist die dynamische Gann-Bereichs-Anpassung: Wenn der Kurs innerhalb eines bestimmten Gann-Bereichs liegt, wird der Zielpreis automatisch auf den nächsten Gann-Key-Bereich angepasst. So wird sowohl ein angemessener Risiko-Gewinn-Verhältnis als auch die natürliche Unterstützungs-Widerstandsstruktur des Marktes kombiniert.

️ Anwendungs- und Risikohinweise

Diese Strategie funktioniert sehr gut, wenn der Trend eindeutig ist, aber es gibt kleine Verluste in Folge, wenn der Kurs schwankt. Die historische Rückschau zeigt, dass die Gewinnrate bei einer Marktumgebung mit einer Schwankung von unter 30% des Durchschnitts sinkt auf etwa 45%.

Risikomanagement ist entscheidend: Ein einzelner Verlust sollte nicht mehr als 2% des Kontogeldes betragen. Es wird empfohlen, den Handel nach 3 aufeinanderfolgenden Verlusten einzustellen.

Strategiequellcode
/*backtest
start: 2025-01-01 00:00:00
end: 2025-08-24 08:00:00
period: 1d
basePeriod: 1d
exchanges: [{"eid":"Futures_Binance","currency":"BTC_USDT"}]
*/

//@version=5
//@version=5
strategy('Trial-TREND Strategy ', overlay=true
     )
// ===== INPUTS =====
Periods = input(title='ATR Period', defval=10)
src = input(hl2, title='Source')
Multiplier = input.float(title='ATR Multiplier', step=0.1, defval=3)
changeATR = input(title='Change ATR Calculation Method ?', defval=true)
showsignals = input(title='Show Buy/Sell Signals ?', defval=false)
//highlighting = input(title="Highlighter On/Off ?", type=input.bool, defval=true)
//barcoloring = input(title="Bar Coloring On/Off ?", type=input.bool, defval=true)

// ===== ATR & SUPER TREND (K-TREND) CALCULATION =====
atr2 = ta.sma(ta.tr, Periods)
atr = changeATR ? ta.atr(Periods) : atr2
up = src - Multiplier * atr
up1 = nz(up[1], up)
up := close[1] > up1 ? math.max(up, up1) : up
dn = src + Multiplier * atr
dn1 = nz(dn[1], dn)
dn := close[1] < dn1 ? math.min(dn, dn1) : dn
trend = 1
trend := nz(trend[1], trend)
trend := trend == -1 and close > dn1 ? 1 : trend == 1 and close < up1 ? -1 : trend

// Plot SuperTrend
upPlot = plot(trend == 1 ? up : na, title='Up Trend', style=plot.style_linebr, linewidth=5, color=color.new(color.blue, 0))
buySignal = trend == 1 and trend[1] == -1
plotshape(buySignal ? up : na, title='UpTrend Begins', location=location.absolute, style=shape.circle, size=size.tiny, color=color.new(color.blue, 0))
dnPlot = plot(trend == 1 ? na : dn, title='Down Trend', style=plot.style_linebr, linewidth=5, color=color.new(color.red, 0))
sellSignal = trend == -1 and trend[1] == 1
plotshape(sellSignal ? dn : na, title='DownTrend Begins', location=location.absolute, style=shape.circle, size=size.tiny, color=color.new(color.red, 0))

mPlot = plot(ohlc4, title='', style=plot.style_circles, linewidth=0)


// ===== GANN SQUARE OF 9 =====
_normalise_squareRootCurrentClose = math.floor(math.sqrt(close[0]))
_upperGannLevel_1 = (_normalise_squareRootCurrentClose + 1) * (_normalise_squareRootCurrentClose + 1)
_upperGannLevel_2 = (_normalise_squareRootCurrentClose + 2) * (_normalise_squareRootCurrentClose + 2)
_zeroGannLevel = _normalise_squareRootCurrentClose * _normalise_squareRootCurrentClose
_lowerGannLevel_1 = (_normalise_squareRootCurrentClose - 1) * (_normalise_squareRootCurrentClose - 1)
_lowerGannLevel_2 = (_normalise_squareRootCurrentClose - 2) * (_normalise_squareRootCurrentClose - 2)

plot(_upperGannLevel_1, color=color.new(color.black, 00), linewidth=2, title='_upperGannLevel_1', style=plot.style_circles)
plot(_upperGannLevel_2, color=color.new(color.black, 00), linewidth=2, title='_upperGannLevel_2', style=plot.style_circles)
plot(_zeroGannLevel, color=color.new(color.black, 00), linewidth=2, title='_zeroGannLevel', style=plot.style_circles)
plot(_lowerGannLevel_1, color=color.new(color.black, 00), linewidth=2, title='_lowerGannLevel_1', style=plot.style_circles)
plot(_lowerGannLevel_2, color=color.new(color.black, 00), linewidth=2, title='_lowerGannLevel_2', style=plot.style_circles)

// ===== SMOOTHED HEIKIN ASHI CALCULATION =====
// --- Inputs for MA Lengths ---
ma1_len = input.int(title='MA1', defval=11, minval=1, maxval=100, step=1)
ma2_len = input.int(title='MA2', defval=11, minval=1, maxval=100, step=1)
ma3_len = input.int(title='MA3', defval=20, minval=1, maxval=100, step=1)
ma4_len = input.int(title='MA4', defval=20, minval=1, maxval=100, step=1)

// --- First Smoothing (11,11) ---
o = ta.ema(open, ma1_len) // MA1 = 11
c = ta.ema(close, ma1_len)
h = ta.ema(high, ma1_len)
l = ta.ema(low, ma1_len)
ha_t = ticker.heikinashi(syminfo.tickerid)
ha_o = request.security(ha_t, timeframe.period, o)
ha_c = request.security(ha_t, timeframe.period, c)
ha_h = request.security(ha_t, timeframe.period, h)
ha_l = request.security(ha_t, timeframe.period, l)
o2 = ta.ema(ha_o, ma2_len) // MA2 = 11
c2 = ta.ema(ha_c, ma2_len)
h2 = ta.ema(ha_h, ma2_len)
l2 = ta.ema(ha_l, ma2_len)
ha_col = o2 > c2 ? color.orange : color.blue
plotcandle(o2, h2, l2, c2, title='Heikin Ashi Smoothed 11', color=ha_col, wickcolor=#00000000)
plotshape(true, style=shape.circle, color=o2 < c2 ? color.blue : color.orange, location=location.bottom)

// --- Second Smoothing (20,20) ---
o1 = ta.ema(open, ma3_len) // MA3 = 20
c1 = ta.ema(close, ma3_len)
h1 = ta.ema(high, ma3_len)
l1 = ta.ema(low, ma3_len)
[ha_o1, ha_c1, ha_h1, ha_l1] = request.security(ha_t, timeframe.period, [o1, c1, h1, l1], lookahead=barmerge.lookahead_on)
o3 = ta.ema(ha_o1, ma4_len) // MA4 = 20
c3 = ta.ema(ha_c1, ma4_len)
h3 = ta.ema(ha_h1, ma4_len)
l3 = ta.ema(ha_l1, ma4_len)
ha_col1 = o3 > c3 ? color.purple : color.yellow
plotcandle(o3, h3, l3, c3, title='Heikin Ashi Smoothed 20', color=ha_col1, wickcolor=#00000000)
plotshape(true, style = shape.circle, color = o3 < c3 ? #5a1fe2 : color.rgb(255, 0, 128), location = location.top)

// ===== DYNAMIC ENTRY CONDITIONS =====
var alert_msg = string('')
var float TARGET1 = 0.0
var float TARGET2 = 0.0
var float TARGET3 = 0.0
var float SL = 0.0
var action = string('')
var table_bg_color = color.white
var table_position = position.bottom_left 
var UpTabl = table.new(position = table_position, columns=6, rows=3, bgcolor=color.rgb(255, 255, 255), border_width=2, frame_color=color.black, frame_width=3)

// Initialize Table
table.cell(table_id=UpTabl, column=2, row=0, text='K-TREND')
table.cell(table_id=UpTabl, column=0, row=1, text='Action')
table.cell(table_id=UpTabl, column=1, row=1, text='Price')
table.cell(table_id=UpTabl, column=2, row=1, text='SL')
table.cell(table_id=UpTabl, column=3, row=1, text='TARGET1')
table.cell(table_id=UpTabl, column=4, row=1, text='TARGET2')
table.cell(table_id=UpTabl, column=5, row=1, text='TARGET3')

// --- DEFINE NEW ENTRY CONDITIONS WITH OR LOGIC ---
// New Additional Long Conditions
// Bullish Crossover: Fast HA candle (11,11) breaks above Slow HA candle (20,20)
haCrossUp = (l2 > h3) and (l2[1] <= h3[1])
priceHitLowerGann = (low <= _lowerGannLevel_1 and close > _lowerGannLevel_1) or (low <= _lowerGannLevel_2 and close > _lowerGannLevel_2)
gannBullishCondition1 = priceHitLowerGann and trend == 1 // Price hit Gann & SuperTrend Bullish
gannBullishCondition2 = priceHitLowerGann and o2 < c2   // Price hit Gann & HA 11,11 Bullish

// Combine all possible long triggers with OR logic
anyLongTrigger = (o2 < c2 and trend == 1) or haCrossUp or gannBullishCondition1 or gannBullishCondition2
// Final Combined Long Condition: ANY trigger must be true AND we must be flat or in a short position
longCondition = anyLongTrigger and (action == 'SELL' or action == string('')) and barstate.isconfirmed

// New Additional Short Conditions
// Bearish Crossunder: Fast HA candle (11,11) breaks below Slow HA candle (20,20)
haCrossDown = (h2 < l3) and (h2[1] >= l3[1])
priceHitUpperGann = (high >= _upperGannLevel_1 and close < _upperGannLevel_1) or (high >= _upperGannLevel_2 and close < _upperGannLevel_2)
gannBearishCondition1 = priceHitUpperGann and trend == -1 // Price hit Gann & SuperTrend Bearish
gannBearishCondition2 = priceHitUpperGann and o2 > c2    // Price hit Gann & HA 11,11 Bearish

// Combine all possible short triggers with OR logic
anyShortTrigger = (o2 > c2 and trend == -1) or haCrossDown or gannBearishCondition1 or gannBearishCondition2
// Final Combined Short Condition: ANY trigger must be true AND we must be flat or in a long position
shortCondition = anyShortTrigger and (action == 'BUY' or action == string('')) and barstate.isconfirmed

// ===== STRATEGY EXECUTION =====
if longCondition 
    SL := math.round(up, 2)
    range_1 = math.abs(close - SL)
    TARGET1 := close + range_1 * 1.7
    TARGET2 := close + range_1 * 2.5
    TARGET3 := close + range_1 * 3.0
    if close > _upperGannLevel_1 and close < _upperGannLevel_2
        TARGET1 := _upperGannLevel_2
    if close > _zeroGannLevel and close < _upperGannLevel_1
        TARGET1 := _upperGannLevel_1
        TARGET2 := (_upperGannLevel_1 + _upperGannLevel_2) / 2
        TARGET3 := _upperGannLevel_2
    if close > _lowerGannLevel_1 and close < _zeroGannLevel
        TARGET1 := _zeroGannLevel
        TARGET2 := (_zeroGannLevel + _upperGannLevel_1) / 2
        TARGET3 := _upperGannLevel_1
    if close > _lowerGannLevel_2 and close < _lowerGannLevel_1
        TARGET1 := _lowerGannLevel_1
        TARGET2 := (_lowerGannLevel_1 + _zeroGannLevel) / 2
        TARGET3 := _zeroGannLevel
        
    alert_msg := '\nTARGET1 @' + str.tostring(TARGET1) + '\nTARGET2 @' + str.tostring(TARGET2) + '\nTARGET3 @' + str.tostring(TARGET3) + '\n SL @' + str.tostring(SL)
    strategy.entry('BUY', strategy.long, alert_message=alert_msg)
    strategy.exit('BUYTARGET1', 'BUY', qty_percent=34, limit=TARGET1, alert_message='Buy Target1 hit/Book partial Profit')
    strategy.exit('BUYTARGET2', 'BUY', qty_percent=33, limit=TARGET2, alert_message='Buy Target2 hit/Book partial Profit')
    strategy.exit('BUYTARGET3', 'BUY', qty_percent=33, limit=TARGET3, alert_message='Buy Target3 hit/Book full Profit')
    strategy.exit('BSL', 'BUY', stop=SL, alert_message='Buy SL hit')
    table.cell(table_id=UpTabl, column=0, row=2, text='Buy')
    table.cell(table_id=UpTabl, column=1, row=2, text=str.tostring(close))
    table.cell(table_id=UpTabl, column=2, row=2, text=str.tostring(SL))
    table.cell(table_id=UpTabl, column=3, row=2, text=str.tostring(TARGET1))
    table.cell(table_id=UpTabl, column=4, row=2, text=str.tostring(TARGET2))
    table.cell(table_id=UpTabl, column=5, row=2, text=str.tostring(TARGET3))
    action := 'BUY'
    table_bg_color := color.lime
    table.set_bgcolor(table_id=UpTabl, bgcolor=table_bg_color)

if shortCondition 
    SL := math.round(dn, 2)
    range_2 = math.abs(close - SL)
    TARGET1 := close - range_2 * 1.7
    TARGET2 := close - range_2 * 2.5
    TARGET3 := close - range_2 * 3.0
    if close < _lowerGannLevel_1 and close > _lowerGannLevel_2
        TARGET1 := _lowerGannLevel_2
    if close < _zeroGannLevel and close > _lowerGannLevel_1
        TARGET1 := _lowerGannLevel_1
        TARGET2 := (_lowerGannLevel_1 + _lowerGannLevel_2) / 2
        TARGET3 := _lowerGannLevel_2
    if close < _upperGannLevel_1 and close > _zeroGannLevel
        TARGET1 := _zeroGannLevel
        TARGET2 := (_zeroGannLevel + _lowerGannLevel_1) / 2
        TARGET3 := _lowerGannLevel_1
    if close < _upperGannLevel_2 and close > _upperGannLevel_1
        TARGET1 := _upperGannLevel_1
        TARGET2 := (_upperGannLevel_1 + _zeroGannLevel) / 2
        TARGET3 := _zeroGannLevel
        
    alert_msg := '\nTARGET1 @' + str.tostring(TARGET1) + '\nTARGET2 @' + str.tostring(TARGET2) + '\nTARGET3 @' + str.tostring(TARGET3) + '\n SL @' + str.tostring(SL)
    strategy.entry('SELL', strategy.short, alert_message=alert_msg)
    strategy.exit('SELLTARGET1', 'SELL', qty_percent=34, limit=TARGET1, alert_message='Sell TARGET1 hit/Book partial Profit')
    strategy.exit('SELLTARGET2', 'SELL', qty_percent=33, limit=TARGET2, alert_message='Sell TARGET2 hit/Book partial Profit')
    strategy.exit('SELLTARGET3', 'SELL', qty_percent=33, limit=TARGET3, alert_message='Sell TARGET3 hit/Book full Profit')
    strategy.exit('SELLSL', 'SELL', stop=SL, alert_message='Sell SL hit')
    table.cell(table_id=UpTabl, column=0, row=2, text='Sell')
    table.cell(table_id=UpTabl, column=1, row=2, text=str.tostring(close))
    table.cell(table_id=UpTabl, column=2, row=2, text=str.tostring(SL))
    table.cell(table_id=UpTabl, column=3, row=2, text=str.tostring(TARGET1))
    table.cell(table_id=UpTabl, column=4, row=2, text=str.tostring(TARGET2))
    table.cell(table_id=UpTabl, column=5, row=2, text=str.tostring(TARGET3))
    action := 'SELL'
    table_bg_color := color.orange
    table.set_bgcolor(table_id=UpTabl, bgcolor=table_bg_color)

// ===== EXIT CONDITIONS =====
if action == 'BUY' and barstate.isconfirmed and o2 > c2
    strategy.close_all(comment='Long Exit', alert_message='Long Exit')
    table.clear(UpTabl, 0, 2, 5, 2)
    action := string('')
    table_bg_color := color.gray
    table.set_bgcolor(table_id=UpTabl, bgcolor=table_bg_color)

if action == 'SELL' and barstate.isconfirmed and o2 < c2
    strategy.close_all(comment='Short Exit', alert_message='Sell Exit')
    table.clear(UpTabl, 0, 2, 5, 2)
    action := string('')
    table_bg_color := color.gray
    table.set_bgcolor(table_id=UpTabl, bgcolor=table_bg_color)

// ===== PLOT ENTRY SHAPES =====
plotshape(barstate.isconfirmed and longCondition ? close : na, title='B', text='BUY', location=location.belowbar, style=shape.labelup, size=size.tiny, color=color.new(color.green, 0), textcolor=color.new(color.white, 0))
plotshape(barstate.isconfirmed and shortCondition ? close : na, title='S', text='SHORT', location=location.abovebar, style=shape.labeldown, size=size.tiny, color=color.new(color.red, 0), textcolor=color.new(color.white, 0))