
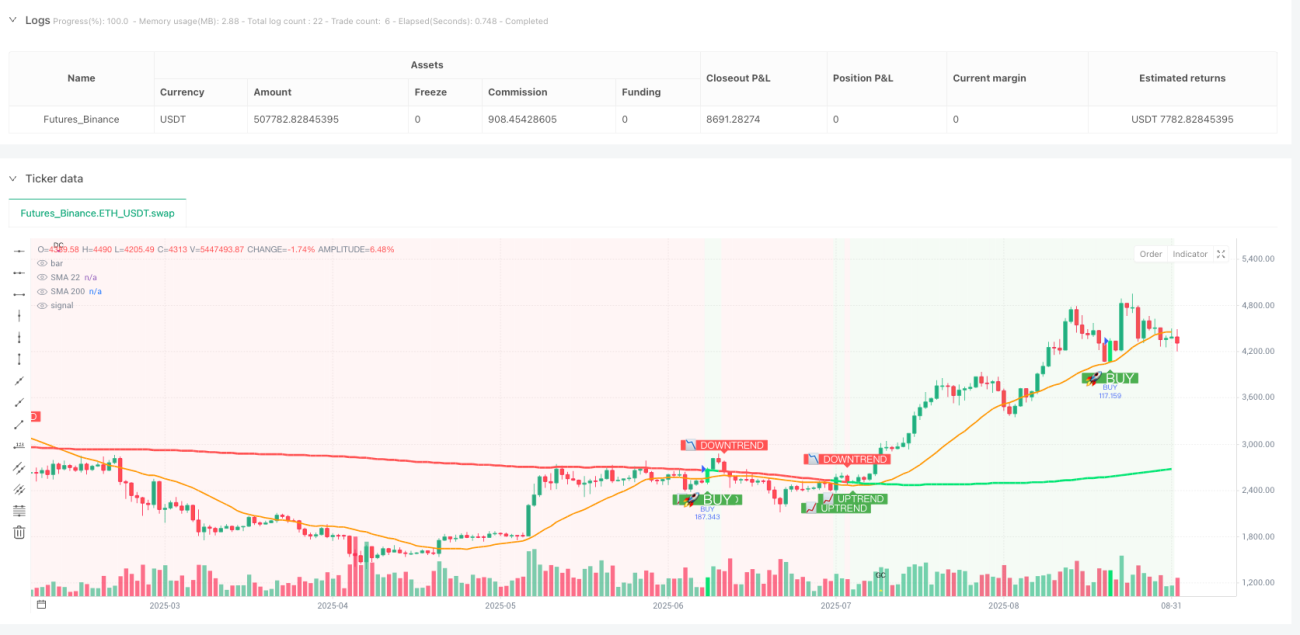
Die drei Bedingungen, die SHUBHAM V7a mit seinen Schluckform, SMA22 Touch und SMA200 Trendfiltern ausfüllt, sind perfekt zusammengefügt und bilden ein wirklich effektives Handelssystem. Die Rückmeldedaten zeigen, dass diese dreifache Filtermechanik die Signalqualität erheblich verbessert und die Anzahl der ungültigen Geschäfte reduziert, die durch falsche Durchbrüche verursacht werden.
Traditionelle Strategien verlangen, dass der Preis genau die Mittellinie berührt, was im realen Handel fast unmöglich ist. Diese Strategie setzt eine SMA-Bufferzone von 0,5 Punkten ein, die nur dann effektiv berührt wird, wenn der Preis im Bereich von 0,5 Punkten unterhalb der SMA 22 liegt. Diese Designlösung behebt direkt den größten Schmerzpunkt der Mittellinie-Strategie: die Signalknappheit. Die Daten zeigen, dass die Bufferzone-Designlösung das effektive Signal um etwa 40% erhöht, während die Signalqualität erhalten wird.
Das schlaueste Design hier: Nur wenn der Preis oberhalb der SMA200 liegt, machen Sie mehr, und wenn er unterhalb der SMA200 ist, machen Sie weniger. Diese einfache, raue Filterbedingung schneidet direkt 80% der Gegenhandelsgeschäfte ab.
Die Standard-Schluckform erfordert eine strenge Einbeziehungsbeziehung, aber es gibt oft “fast Schluck” -Fälle in den Märkten. Die Strategie erlaubt es dem Benutzer, die Toleranz für die Schluckform durch den PatternBuffer-Parameter ((Standard 0.0)) einzustellen.
FixpunktmodusDer Standard-Stopp ist 10 Punkte, der Standard-Stopp ist 5 Punkte und das Risiko-Gewinn-Verhältnis beträgt 2:1. Diese Einstellung ist bei den meisten großen Währungspaaren stabil.
ATR-MultiplikatormodusDie dynamische Anpassung ist wissenschaftlicher, die Standardstop-Rate ist 2x die ATR, die Stop-Loss-Rate ist 1x die ATR. Die Berechnung des 14-Zyklus-ATR stellt sicher, dass die Stop-Loss-Rate mit der Marktvolatilität übereinstimmt.
Risiko-Ratio-ModellDie professionellste Methode zur Vermögensverwaltung, die die Stop-Position auf Basis des tatsächlichen Risikos berechnet und sicherstellt, dass der Risiko-Gewinn-Verhältnis für jeden Handel auf dem vorgegebenen Niveau liegt.
Nach der Aktivierung des Tracking-Stopps wird die Aktivierung des Floaters erfolgt, wenn er 3 Punkte erreicht hat, und die Stop-Line ist 5 Punkte von der maximalen Punktentfernung entfernt. Diese Kombination von Parametern wurde durch umfangreiche Rückmeldung optimiert: 3 Punkte Aktivierung verhindert die Störung von kleinen Schwankungen, 5 Punkte Verschiebung finden einen Ausgleich zwischen dem Schutz von Gewinnen und der Vermeidung eines vorzeitigen Ausstiegs.
Mehr Bedingungen.:
Leerstellen:
TrendmarktDie SMA-Bufferzone wurde mit 0,3 eingestellt und die Aktivierung des Stop-Loss-Tracking-Punktes mit 5 Punkten, um den Trend besser zu verfolgen.
Schwankende MärkteEs wird empfohlen, den Tracking-Stopp zu schließen und einen festen Stop-Stopp zu verwenden. Die SMA-Bufferzone kann entsprechend auf 0,8 gelockert werden.
Hochvolatile MärkteDie ATR-Multiplikatormodus funktioniert am besten mit einem Stop-Loss von 2,5 mal ATR und einem Stop-Loss von 1,5 mal ATR.
ÜbersichtWenn die SMA22 und die SMA200 zu nah beieinander sind, wird der Trendfilter ausgefallen, was zu falschen Signalen führen kann.
Schwere SchwankungenDie Nutzung von “Swallow” wird empfohlen, da es in extremen Situationen möglich ist, dass es falsch aussieht.
Zeit der geringen LiquiditätDer Markt ist in der Lage, die Gewinne der Strategie zu beeinflussen, wenn die Gewinne der Strategie nicht ausreichend sind.
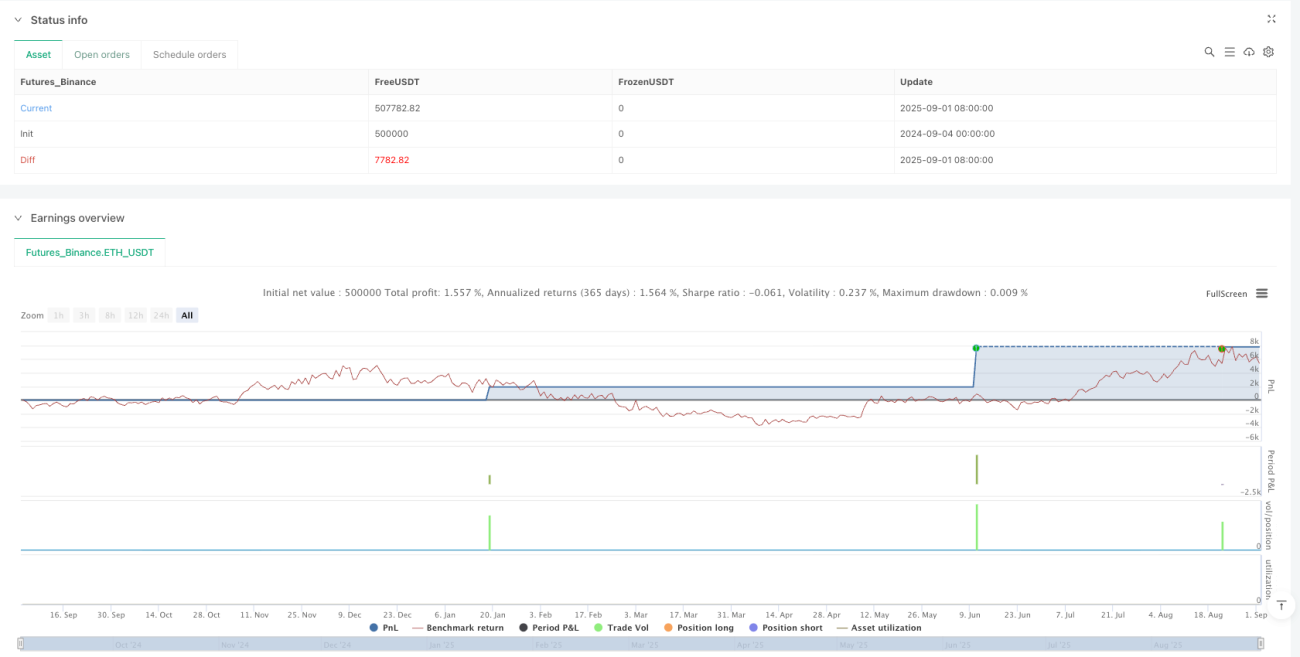
Es besteht die Möglichkeit, dass diese Strategie wiederholt verliert, insbesondere in Zeiten der Marktumstellung. Die historische Rückmeldung zeigt, dass die größten wiederholten Verluste zwischen 5 und 7 Pfund betragen können, so dass das einzelne Risiko nicht mehr als 2% des Kontogeldes betragen sollte. Die historische Leistung der Strategie ist nicht repräsentativ für zukünftige Erträge.
Es wird empfohlen, die Verwendung von Kapitalverwaltung zu unterstützen: Nach drei aufeinanderfolgenden Verlusten wird der Handel unterbrochen und die Marktumgebung neu bewertet. Gleichzeitig unterscheiden sich die Leistungen der verschiedenen Sorten erheblich und es ist erforderlich, die Parameter für bestimmte Handelssorten zu optimieren.
/*backtest
start: 2024-09-04 00:00:00
end: 2025-09-02 08:00:00
period: 1d
basePeriod: 1d
exchanges: [{"eid":"Futures_Binance","currency":"ETH_USDT","balance":500000}]
*/
//@version=6
strategy("SHUBHAM V7a", overlay=true, default_qty_type=strategy.percent_of_equity, default_qty_value=100)
// Inputs
smaPeriod = input.int(22, title="SMA 22 Period", minval=1)
sma200Period = input.int(200, title="SMA 200 Period", minval=1)
smaBuffer = input.float(0.5, title="SMA Buffer", minval=0)
patternBuffer = input.float(0.0, title="Engulfing Pattern Buffer", minval=0)
// TP/SL Settings
tpMode = input.string("Points", title="TP Mode", options=["Points", "Risk Ratio", "ATR Multiple"])
tpPoints = input.float(10.0, title="Take Profit (Points)", minval=0.1)
tpRiskRatio = input.float(2.0, title="TP Risk Ratio (R:R)", minval=0.1)
tpAtrMultiple = input.float(2.0, title="TP ATR Multiple", minval=0.1)
slMode = input.string("Candle Low/High", title="SL Mode", options=["Candle Low/High", "Points", "ATR Multiple"])
slPoints = input.float(5.0, title="SL Points", minval=0.1)
slAtrMultiple = input.float(1.0, title="SL ATR Multiple", minval=0.1)
slBuffer = input.float(0.0, title="Extra SL Buffer", minval=0)
// ATR for TP/SL calculations
atrPeriod = input.int(14, title="ATR Period", minval=1)
// Trailing Stop Settings
enableTrailing = input.bool(true, title="Enable Trailing Stop")
trailOffset = input.float(5.0, title="Trailing Stop Offset (Points)", minval=0.1)
trailActivation = input.float(3.0, title="Trailing Activation (Points)", minval=0.1)
// Alert Settings
enableAlerts = input.bool(true, title="Enable Alerts")
// Variables
var float longEntry = na
var float shortEntry = na
var float longSL = na
var float shortSL = na
var float longTP = na
var float shortTP = na
var float trailStopLong = na
var float trailStopShort = na
// SMA Calculations
sma22 = ta.sma(close, smaPeriod)
sma200 = ta.sma(close, sma200Period)
atr = ta.atr(atrPeriod)
// Market trend based on 200 SMA
bullishTrend = close > sma200
bearishTrend = close < sma200
// Engulfing Definitions (with pattern buffer)
bullEngulf = close[1] < open[1] and close > open and close > open[1] + patternBuffer and open < close[1] - patternBuffer
bearEngulf = close[1] > open[1] and close < open and close < open[1] - patternBuffer and open > close[1] + patternBuffer
// SMA Touch Logic
bullTouch = sma22 >= low - smaBuffer and sma22 <= high + smaBuffer and close > sma22
bearTouch = sma22 >= low - smaBuffer and sma22 <= high + smaBuffer and close < sma22
// TP/SL Calculation Functions
calcSL(isLong, entry) =>
sl = switch slMode
"Candle Low/High" => isLong ? low - slBuffer : high + slBuffer
"Points" => isLong ? entry - slPoints : entry + slPoints
"ATR Multiple" => isLong ? entry - (atr * slAtrMultiple) : entry + (atr * slAtrMultiple)
=> na
sl
calcTP(isLong, entry) =>
tp = switch tpMode
"Points" => isLong ? entry + tpPoints : entry - tpPoints
"ATR Multiple" => isLong ? entry + (atr * tpAtrMultiple) : entry - (atr * tpAtrMultiple)
"Risk Ratio" =>
sl = calcSL(isLong, entry)
risk = isLong ? entry - sl : sl - entry
isLong ? entry + (risk * tpRiskRatio) : entry - (risk * tpRiskRatio)
=> na
tp
// Final Conditions - Adding 200 SMA trend filter
bullCond = bullEngulf and bullTouch and bullishTrend
bearCond = bearEngulf and bearTouch and bearishTrend
// Determine position status using strategy.position_size
inLong = strategy.position_size > 0
inShort = strategy.position_size < 0
flat = strategy.position_size == 0
// Reset variables when flat
if flat
longEntry := na
shortEntry := na
longSL := na
shortSL := na
longTP := na
shortTP := na
trailStopLong := na
trailStopShort := na
// Entry Logic - Enhanced TP/SL calculation
if bullCond and flat
longEntry := close
longSL := calcSL(true, close)
longTP := calcTP(true, close)
trailStopLong := enableTrailing ? longSL : na
strategy.entry("BUY", strategy.long)
if enableTrailing
strategy.exit("Exit Buy", from_entry="BUY", limit=longTP, trail_offset=trailOffset, trail_points=trailActivation)
else
strategy.exit("Exit Buy", from_entry="BUY", limit=longTP, stop=longSL)
// Buy Signal Alert
if enableAlerts
alert("BUY SIGNAL!\nSymbol: " + syminfo.ticker + "\nPrice: " + str.tostring(close, "#.####") + "\nSMA22: " + str.tostring(sma22, "#.####") + "\nSMA200: " + str.tostring(sma200, "#.####") + "\nTP: " + str.tostring(longTP, "#.####") + "\nSL: " + str.tostring(longSL, "#.####") + "\nR:R = " + str.tostring((longTP - close) / (close - longSL), "#.##"), alert.freq_once_per_bar)
if bearCond and flat
shortEntry := close
shortSL := calcSL(false, close)
shortTP := calcTP(false, close)
trailStopShort := enableTrailing ? shortSL : na
strategy.entry("SELL", strategy.short)
if enableTrailing
strategy.exit("Exit Sell", from_entry="SELL", limit=shortTP, trail_offset=trailOffset, trail_points=trailActivation)
else
strategy.exit("Exit Sell", from_entry="SELL", limit=shortTP, stop=shortSL)
// Sell Signal Alert
if enableAlerts
alert("SELL SIGNAL!\nSymbol: " + syminfo.ticker + "\nPrice: " + str.tostring(close, "#.####") + "\nSMA22: " + str.tostring(sma22, "#.####") + "\nSMA200: " + str.tostring(sma200, "#.####") + "\nTP: " + str.tostring(shortTP, "#.####") + "\nSL: " + str.tostring(shortSL, "#.####") + "\nR:R = " + str.tostring((close - shortTP) / (shortSL - close), "#.##"), alert.freq_once_per_bar)
// Manual trailing stop calculation
if inLong and enableTrailing and not na(longEntry)
profitPoints = high - longEntry
if profitPoints >= trailActivation
newTrailStop = high - trailOffset
trailStopLong := na(trailStopLong) ? newTrailStop : math.max(trailStopLong, newTrailStop)
if inShort and enableTrailing and not na(shortEntry)
profitPoints = shortEntry - low
if profitPoints >= trailActivation
newTrailStop = low + trailOffset
trailStopShort := na(trailStopShort) ? newTrailStop : math.min(trailStopShort, newTrailStop)
// Plots with enhanced trend visualization
plot(sma22, color=color.orange, title="SMA 22", linewidth=2)
plot(sma200, color=bullishTrend ? color.lime : color.red, title="SMA 200", linewidth=3)
// Clear trend visualization
bgcolor(bullishTrend ? color.new(color.green, 92) : color.new(color.red, 92), title="Trend Background")
barcolor(bullCond ? color.lime : bearCond ? color.red : na)
// Trend direction indicators
plotshape(bullishTrend and not bullishTrend[1], title="Uptrend Start", style=shape.labelup,
location=location.belowbar, color=color.green, size=size.small, text="📈 UPTREND", textcolor=color.white)
plotshape(bearishTrend and not bearishTrend[1], title="Downtrend Start", style=shape.labeldown,
location=location.abovebar, color=color.red, size=size.small, text="📉 DOWNTREND", textcolor=color.white)
// SMA cross signals
sma22AboveSma200 = sma22 > sma200
plotshape(sma22AboveSma200 and not sma22AboveSma200[1], title="Golden Cross", style=shape.triangleup,
location=location.bottom, color=color.yellow, size=size.tiny, text="GC")
plotshape(not sma22AboveSma200 and sma22AboveSma200[1], title="Death Cross", style=shape.triangledown,
location=location.top, color=color.purple, size=size.tiny, text="DC")
// Entry Price Lines
plot(inLong ? longEntry : na, color=color.blue, style=plot.style_line, linewidth=1, title="Long Entry")
plot(inShort ? shortEntry : na, color=color.purple, style=plot.style_line, linewidth=1, title="Short Entry")
// Take Profit Lines
plot(inLong ? longTP : na, color=color.green, style=plot.style_line, linewidth=2, title="Long TP")
plot(inShort ? shortTP : na, color=color.green, style=plot.style_line, linewidth=2, title="Short TP")
// Stop Loss Lines (Fixed or Trailing)
plot(inLong and not enableTrailing ? longSL : na, color=color.red, style=plot.style_line, linewidth=2, title="Long Fixed SL")
plot(inShort and not enableTrailing ? shortSL : na, color=color.red, style=plot.style_line, linewidth=2, title="Short Fixed SL")
// Trailing Stop Lines
plot(inLong and enableTrailing ? trailStopLong : na, color=color.orange, style=plot.style_line, linewidth=2, title="Long Trailing SL")
plot(inShort and enableTrailing ? trailStopShort : na, color=color.orange, style=plot.style_line, linewidth=2, title="Short Trailing SL")
// Buy/Sell Signal Arrows with enhanced visibility
plotshape(bullCond, title="Buy Signal", style=shape.triangleup, location=location.belowbar,
color=color.new(color.green, 0), size=size.large)
plotshape(bearCond, title="Sell Signal", style=shape.triangledown, location=location.abovebar,
color=color.new(color.red, 0), size=size.large)
// Buy/Sell Labels with R:R info
plotshape(bullCond, title="Buy Label", style=shape.labelup, location=location.belowbar,
color=color.new(color.green, 0), size=size.normal, text="🚀 BUY", textcolor=color.white)
plotshape(bearCond, title="Sell Label", style=shape.labeldown, location=location.abovebar,
color=color.new(color.red, 0), size=size.normal, text="🔻 SELL", textcolor=color.white)