
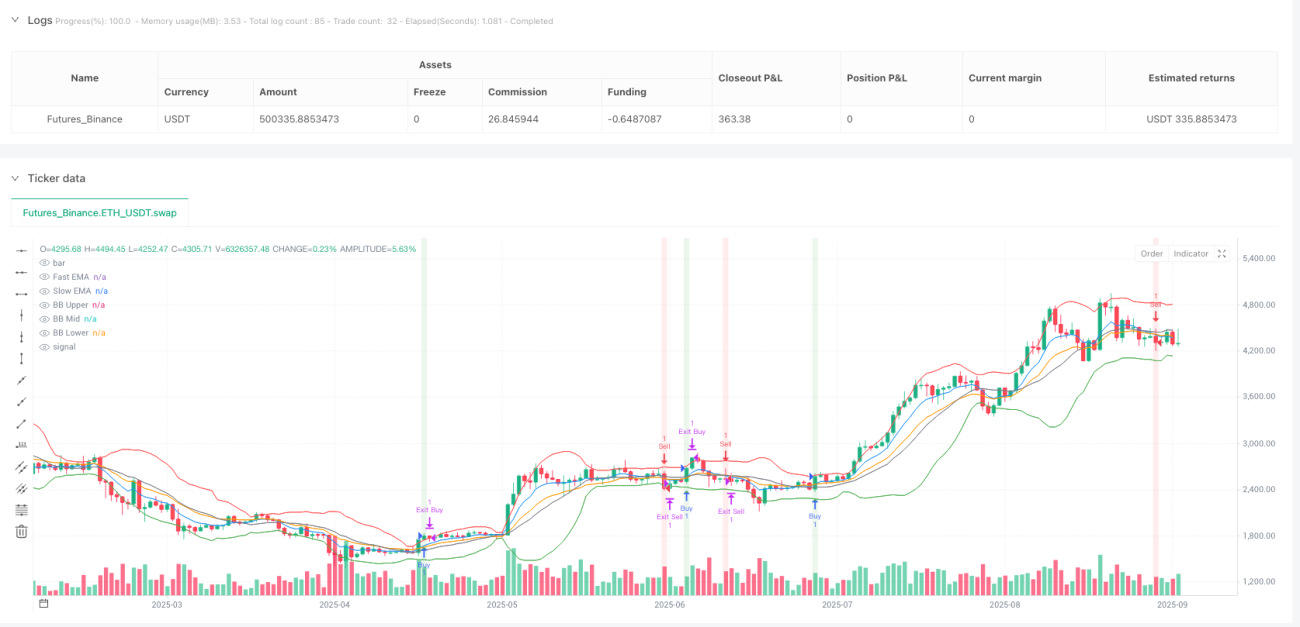
🚀 Wie leistungsstark ist diese Strategie eigentlich?
Wusstest du, dass diese Strategie deinem Trading so etwas wie einen "Feueraugen"-Blick verleiht? Sie wurde speziell für 1-Minuten- und 5-Minuten-Scalping konzipiert und kombiniert die fünf leistungsstärksten technischen Indikatoren: schnelle und langsame EMAs, RSI, MACD, Bollinger-Bänder und einen Volumenfilter. Einfach ausgedrückt: Sie ermöglicht es dir, jede kleine Marktbewegung präzise zu erfassen!
💡 Das Wichtigste! Wie wird diese Kombination eingesetzt?
Stell dir vor, diese Strategie ist wie ein extrem strenger "Interviewer" – nur Handelsmöglichkeiten, die mehrere Bedingungen gleichzeitig erfüllen, bestehen die Auswahl:
Long-Signale müssen erfüllen: Der Kurs liegt über dem schnellen EMA, der MACD zeigt ein goldenes Kreuz und ist positiv, der Kurs durchbricht das obere Bollinger-Band, der RSI liegt zwischen 50 und 80, und es gibt ausreichend Volumenunterstützung. Das ist so streng, als würde man von einem Menschen verlangen, gut auszusehen, talentiert zu sein und einen guten Charakter zu haben!
Short-Signale sind das Gegenteil: Alle Bedingungen müssen umgekehrt erfüllt sein, um sicherzustellen, dass jeder Trade eine solide technische Grundlage hat.
⚡ Fehlervermeidungsleitfaden: Warum Scalping wählen?
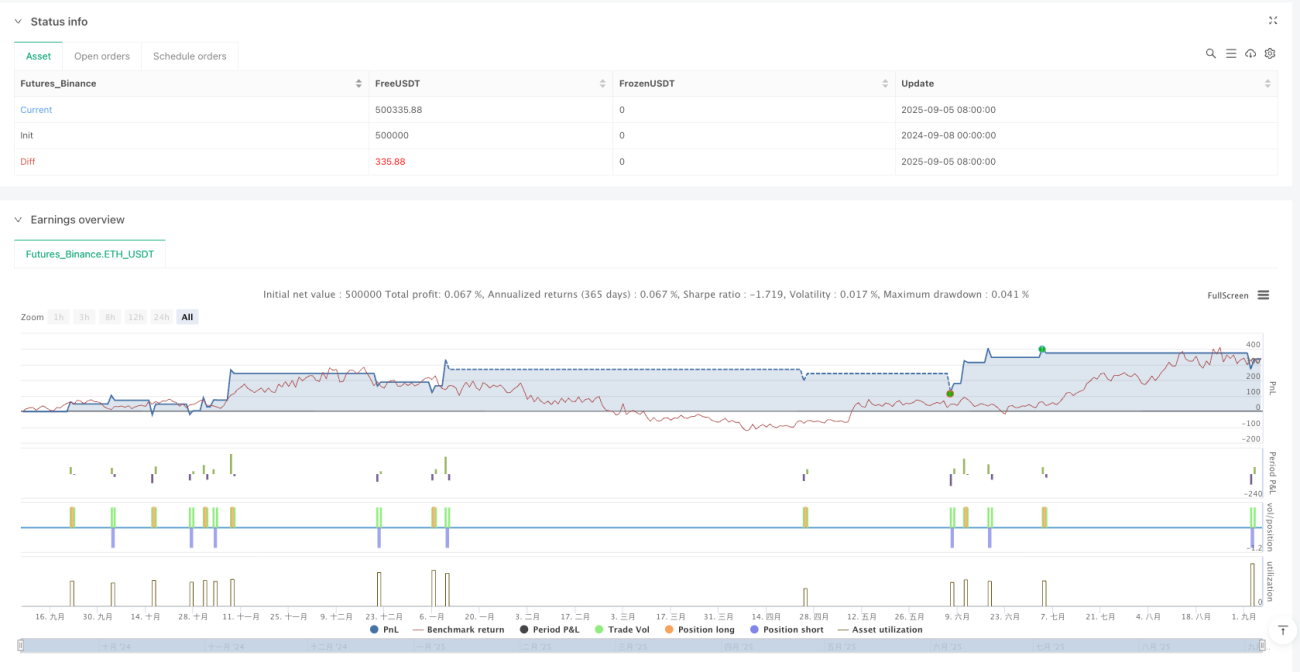
Der klügste Aspekt dieser Strategie ist ihr Risikomanagement! Der Stop-Loss liegt bei 0,5 %, der Take-Profit bei 1,0 %, das Risiko-Ertrags-Verhältnis beträgt 1:2. Das ist wie die perfekte Interpretation von "kleine Einsätze, viel Vergnügen" – jeder Verlust ist sehr gering, aber der Gewinn kann sich verdoppeln!
Und es gibt ein durchdachtes Detail: Im 1-Minuten-Chart wird die Erkennung von Kerzenformationen automatisch deaktiviert, da die Rauschen der Kerzenmuster im Scalping zu groß sind und die Beurteilung irreführen können. Das ist so intelligent wie eine automatische Geräuschunterdrückung in einer lauten Umgebung!
🎯 Praktische Anwendung: Welche Probleme löst diese Strategie für dich?
Zielgruppe: Trader, die im Kryptomarkt Intraday-Trading betreiben möchten, insbesondere diejenigen, die durch kleine, häufige Trades schrittweise Gewinne erzielen wollen.
Schmerzpunkte beseitigen: Schluss mit den falschen Signalen einzelner Indikatoren! Durch die Mehrfachbestätigung wird die Zuverlässigkeit der Signale erheblich verbessert. Gleichzeitig sorgt das strenge Risikomanagement dafür, dass selbst bei Fehleinschätzungen der Verlust kontrollierbar bleibt.
Denk daran: Diese Strategie ist wie ein präzises Skalpell – sie funktioniert am besten auf Paaren mit hoher Liquidität im Kryptomarkt. In Kombination mit einem soliden Money-Management wird sie zu einem wertvollen Werkzeug in deiner Trading-Ausrüstung!
/*backtest
start: 2024-09-08 00:00:00
end: 2025-09-06 08:00:00
period: 1d
basePeriod: 1d
exchanges: [{"eid":"Futures_Binance","currency":"ETH_USDT","balance":500000}]
*/

//@version=5
strategy("Advanced Crypto Scalping Strategy - 1 & 5 Min Charts", overlay=true, margin_long=100, margin_short=100)

// Inputs for customization (optimized for 1-min and 5-min timeframes)- 1