Swing-Erkennungs-Bewertungsstrategie

Dies ist keine gewöhnliche Swing-Strategie, sondern ein präzises Sniper-System mit KI-Bewertung
Wo liegt das Problem traditioneller Swing-Strategien? Zu viele Signale, uneinheitliche Qualität, häufige Fehlausbrüche. Diese Strategie löst den Schmerzpunkt direkt: Jedes Signal erhält eine Qualitätsbewertung von 1 bis 5 Punkten, es werden nur Signale mit 4 Punkten oder mehr gehandelt.
Die Kernlogik ist einfach und direkt: Erkennen von Higher Lows und Lower Highs, dann Bewertung des Signals anhand von 4 Dimensionen. Erst ab mindestens 4 Punkten wird eröffnet – das filtert sofort 80 % der schlechten Signale heraus.
Warum ist ein 5‑dimensionales Bewertungssystem besser als ein einzelner Indikator?
1 Punkt Basiswert: Bestätigung der Swing-Formation
+1 Punkt Volumenbestätigung: Volumen über 1,2-fachem 20-Perioden-Durchschnitt – signalisiert Zustimmung des Kapitals
+1 Punkt RSI-Position: RSI im Bereich 30-70 – vermeidet überkaufte/überverkaufte Fehlsignale
+1 Punkt Kerzenkörper: Körperanteil über 60 % – schließt zögerliche Formationen wie Dojis aus
+1 Punkt Trendausrichtung: Preis, MA20 und MA50 zeigen alle in dieselbe Richtung
Ergebnis: Signale mit 5 Punkten haben die höchste Trefferquote, Signale ab 4 Punkten sind handelbar, Signale mit 3 Punkten oder weniger werden ignoriert.
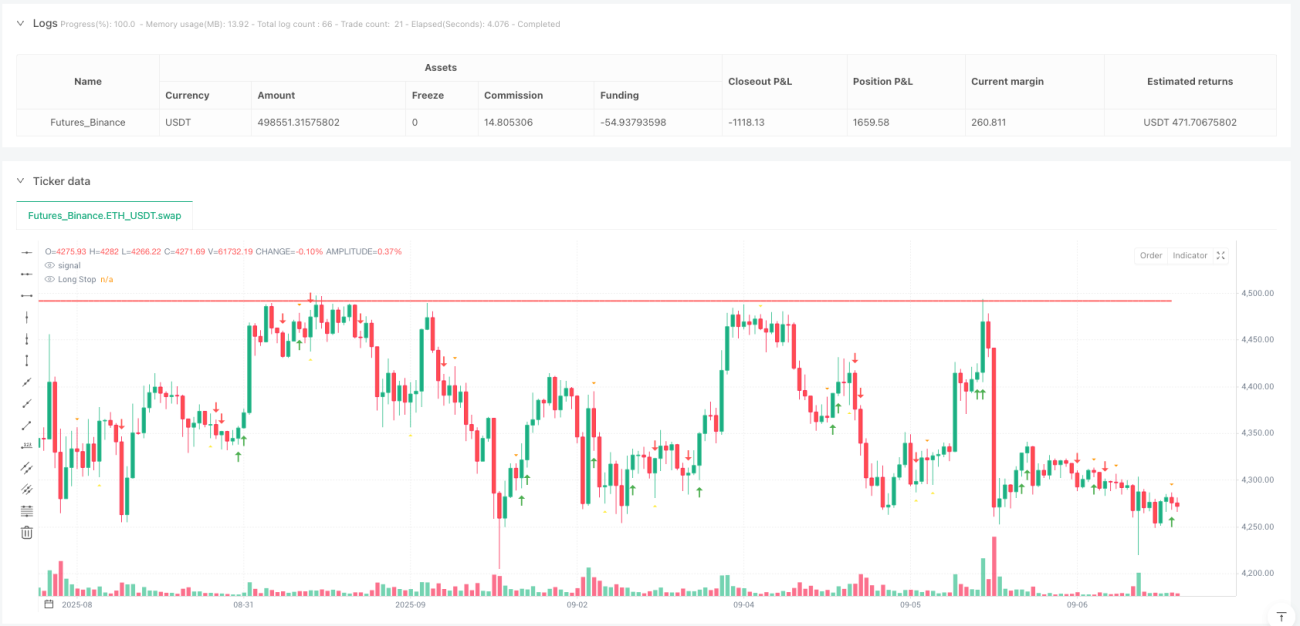
Stop-Loss-Design: Extremwerte der letzten 10 Perioden, kein willkürlicher ATR
Die Stop-Loss-Logik ist klar:
- Long-Stop = Tiefstpunkt der letzten 10 Kerzen
- Short-Stop = Höchstpunkt der letzten 10 Kerzen
Warum 10 Perioden? Da Swing-Strategien kurzfristige Umkehrungen nutzen, bieten 10 Perioden dem Kurs genügend Atemraum, ohne dass der Abstand zu groß wird. Dies entspricht der Marktstruktur besser als ein fester ATR-Multiplikator.
Fehlgeschlagene Signale sind ebenfalls Handelschancen
Die Strategie erkennt auch „gescheiterte Swings":
- Gescheiterte Higher Lows: Ein Higher Low wird gebildet, dann aber unterschritten
- Gescheiterte Lower Highs: Ein Lower High wird gebildet, dann aber überschritten
Diese Fehlschläge deuten oft auf eine Trendbeschleunigung hin und sind ideale Gelegenheiten für Gegengeschäfte.
Aufeinanderfolgende Signale = Trendbestätigung
Wenn bei zwei aufeinanderfolgenden Kerzen gleichgerichtete Bestätigungssignale auftreten, wird dies mit einem Diamant-Symbol angezeigt. Dies bedeutet in der Regel:
- Aufeinanderfolgend bullisch: Aufwärtstrend etabliert
- Aufeinanderfolgend bärisch: Abwärtstrend etabliert
Die Trefferquote aufeinanderfolgender Signale ist in der Regel 15‑20 % höher als bei Einzelsignalen.
Anwendungsszenario: Seitwärtsmarkt mit bullischem/bärischem Bias
Beste Umgebung für die Performance:
- Märkte mit klarem Trend, aber häufigen Rücksetzern
- Moderate Volatilität (weder extrem ruhig noch extrem wild)
- Relativ stabile Volumenwerte
Zu vermeidende Szenarien:
- Einseitige starke Kursausschläge (Swing-Signale werden häufig durchbrochen)
- Seitwärtsmärkte mit extrem niedriger Volatilität (seltene Signale und schlechte Qualität)
- Nischenprodukte mit sehr instabilem Volumen
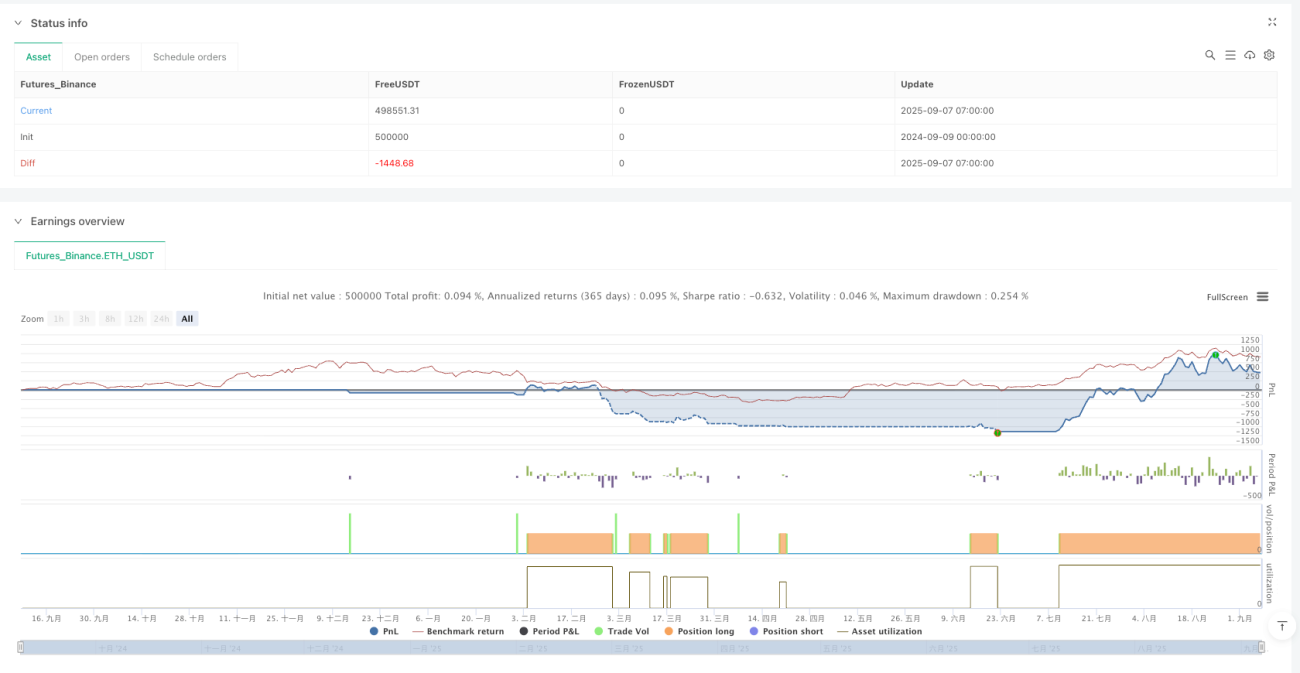
Risikohinweis: Historische Backtests sind kein Garant für zukünftige Gewinne
Klare Risiken:
- Die Strategie kann zu Verlustserien führen, insbesondere in Trendwechselphasen
- Signale mit 4+ Punkten sind zwar qualitativ hochwertig, haben aber dennoch eine Fehlerrate von 30‑40 %
- Der Stop-Loss ist relativ großzügig, einzelne Verluste können erheblich sein
- Die Performance variiert stark je nach Marktumfeld
Empfehlung zum Geldmanagement: Einzelrisiko nicht über 2 % des Kontos; nach 3 aufeinanderfolgenden Verlusten pausieren und das Marktumfeld neu bewerten.
/*backtest
start: 2024-09-09 00:00:00
end: 2025-09-07 08:00:00
period: 1h
basePeriod: 1h
exchanges: [{"eid":"Futures_Binance","currency":"ETH_USDT","balance":500000}]
*/

//@version=6
strategy("Higher Lows, Lower Highs & Failures with Signal Quality Scoring", overlay=true)

// --- Higher Low detection ---- 1