Intelligenter Sparplan-Roboter

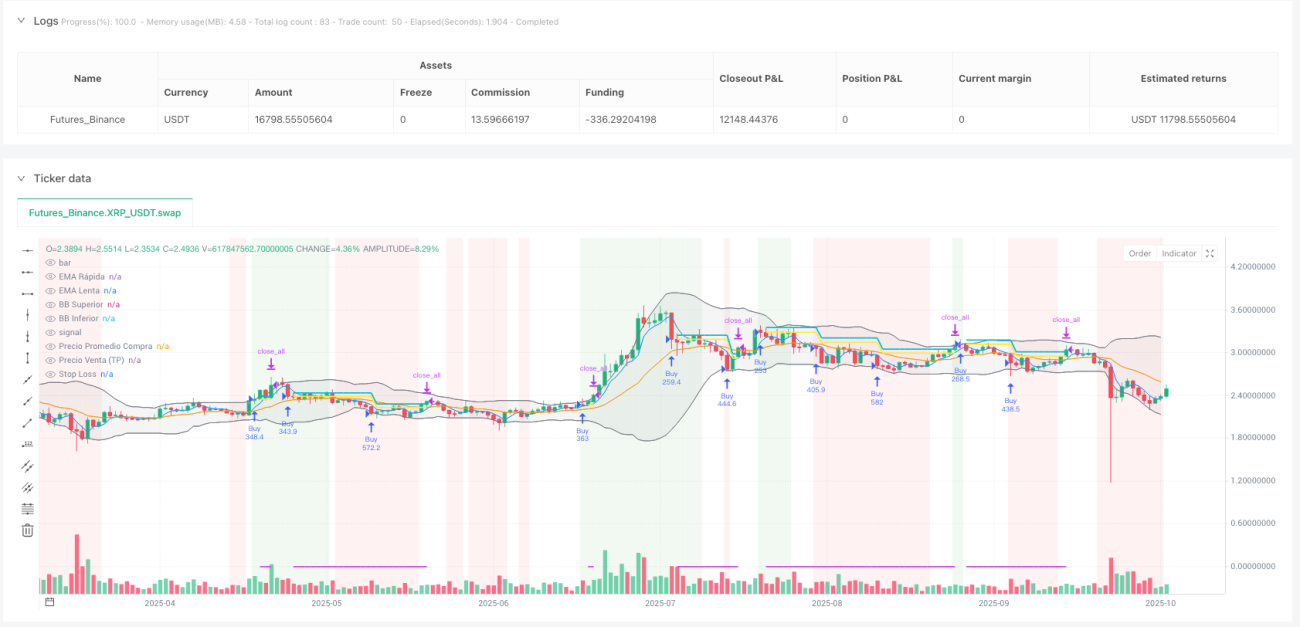
🤖 Das ist kein gewöhnlicher Sparplan – das ist ein denkender Sparplan-Roboter!
Wusstest du das? Die meisten Leute machen Sparpläne wie „Kaufen, kaufen, kaufen“ ohne nachzudenken. Aber diese Strategie ist, als hättest du einen superschlauen Investment-Assistenten! Sie passt den Kaufbetrag an die Marktbedingungen an, beginnend mit 5 % und steigert ihn schrittweise bis auf 100 %. Wie wenn du auf dem Markt einkaufst – kaufe mehr, wenn es günstig ist, und weniger, wenn es teuer ist. Einfach, brutal, aber extrem effektiv!
📊 Vier technische Indikatoren im Team – Markttrends auf einen Blick
Wichtiger Punkt! Diese Strategie nutzt eine Kombination aus vier technischen Indikatoren:
- Schneller/langsamer EMA: Wie ein „EKG“ des Marktes, das die Trendrichtung anzeigt
- MACD: Das „Barometer“ der Marktdynamik zur Bestimmung von Kauf- und Verkaufszeitpunkten
- RSI: Das „Thermometer“ für überkaufte/überverkaufte Zustände, um Jagd auf Höchststände und Verkauf zu Tiefstständen zu vermeiden
- Bollinger-Bänder: Die „Sicherheitszone“ für Preisvolatilität zur Bestimmung von Unterstützung und Widerstand
Diese vier Indikatoren arbeiten zusammen wie die „Avengers“ – jeder hat seine Aufgabe, aber sie harmonieren perfekt!
💡 Smarte Aufstockungslogik: Je tiefer der Kurs, desto mehr kaufen
Fallstrick-Warnung! Das größte Problem bei normalen Sparplänen ist die mangelnde Positionskontrolle. Diese Strategie ist viel klüger:
- Erster Kauf mit 5 % des Kapitals zum Testen
- Jeder weitere Kauf erhöht sich um 2,5 %
- Je stärker der Kurs fällt, desto größer die Abstände zwischen den Käufen (2 %, 6 %, 10 % …)
- Maximaler Einzelkauf überschreitet nie 100 % des Gesamtkapitals
Wie beim Leveln in einem Videospiel – die Investition wird im Verlauf größer, aber das Risiko bleibt streng kontrolliert!
🎯 Cleveres Take-Profit und Stop-Loss: Gewinne laufen lassen, Verluste begrenzen
Die Verkaufslogik dieser Strategie ist super benutzerfreundlich:
- Mindestens 2 % Gewinn, bevor ein Verkauf in Betracht gezogen wird: Keine „viel Arbeit für nichts“
- Ausstieg bei schwächelndem Trend: Gewinne mitnehmen, sichern und einstreichen
- Kursrückgang von 2 % löst Verkaufssignal aus: Schützt Gewinne vor Rückgabe
- Konfigurierbarer Stop-Loss: Obwohl die Voreinstellung 100 % ist (praktisch nie ausgelöst), kannst du ihn an deine Risikobereitschaft anpassen
Kurz gesagt: Diese Strategie ist „gnadenlos, wenn es ums Geldverdienen geht, und entschlossen, wenn es Zeit zum Aussteigen ist“!
// This Pine Script™ code is subject to the terms of the MPL 2.0 at https://mozilla.org/MPL/2.0/
// © MTB by Neurodoc
// By Nicolás Astorga

//@version=5
strategy("Master Trading Bot by Neurodoc",
         shorttitle="MTB Adaptation",
         overlay=true,
         initial_capital=10000,
         pyramiding=100,
         commission_value=0.1,
commission_type=strategy.commission.percent,- 1