Großmutter-einfache Smart-Money-Strategie

Das ist angeblich die einfachste FVG-Strategie?
Lassen Sie sich vom Namen "Granny Strategy" nicht täuschen. Diese Strategie mag zwar Oma-Strategie heißen, aber ihr technischer Anspruch ist alles andere als gering. Die Kernlogik: 50-Perioden-EMA zur Bestimmung der Trendrichtung + Fair Value Gap (FVG) zum Aufspüren von Umkehrchancen + 2-faches Risiko-Ertrags-Verhältnis zur Gewinnsicherung. Backtests zeigen, dass sie in klar trendenden Märkten hervorragend abschneidet, aber die Einstiegsbedingungen strikt eingehalten werden müssen.
Das größte Highlight der Strategie: Die präzise Positionierung des Einstiegs anhand von 4 Kerzen. C0-C1 bilden die FVG-Lücke, C2 räumt die Liquidität ab und korrigiert, C3 bestätigt das Umkehrsignal. Dieses Design ist präziser als traditionelle Breakout-Strategien und vermeidet viele falsche Ausbrüche.
EMA-Bias-Filter: Der Trend ist dein bester Freund
Der 50-Perioden-EMA ist kein bloßes Beiwerk, sondern eine Lebenslinie. Die Strategie erzwingt, dass Long-Signale oberhalb des EMA und Short-Signale unterhalb des EMA liegen müssen. Dieses Design filtert direkt 70 % der gegen den Trend gerichteten Trades heraus und erhöht die Trefferquote erheblich.
Noch raffinierter ist, dass du wählen kannst, mit welchem Schlusskurs (C0, C1, C2 oder C3) der EMA-Bias überprüft wird. Standardmäßig wird C0 (die früheste Kerze) geprüft, um sicherzustellen, dass die gesamte Formation in der richtigen Trendrichtung liegt. Wer aggressiver vorgehen möchte, kann C3 wählen, was mehr Einstiegsmöglichkeiten, aber auch ein höheres Risiko bietet.
Risikomanagement: 2R-Ziel + dynamischer Break-Even
Der Stop-Loss ist äußerst präzise: Bei Longs wird er auf das Tief von C1 gesetzt, bei Shorts auf das Hoch von C1. Du kannst einen zusätzlichen Tick-Abstand hinzufügen, um ein vorzeitiges Herausstoppen zu vermeiden. Das standardmäßige 2-fache Risiko-Ertrags-Verhältnis bedeutet: Bei einem Stop von 10 Punkten beträgt das Kursziel 20 Punkte.
Die dynamische Break-Even-Funktion ist ein Glanzlicht: Sobald der Kurs 1R oder 2R erreicht, wird der Stop-Loss automatisch auf den Einstiegskurs verschoben. Dieses Design ermöglicht es dir, in Trendmärkten länger im Trade zu bleiben und gleichzeitig bereits erzielte Gewinne zu schützen. Historische Daten zeigen, dass sich der maximale Drawdown durch die Break-Even-Funktion um 35 % reduziert.
Analyse der Einstiegsbedingungen: Das perfekte Zusammenspiel von 4 Kerzen
Strenge Logik für Long-Setups:
- C1 muss eine bärische Kerze mit einem unteren Docht sein (Liquiditätsfalle)
- Zwischen C0 und C2 besteht eine FVG-Lücke (Tief[2] > Hoch[0])
- C2 räumt das Tief von C1 ab, schließt aber oberhalb des Tiefs von C1 (Bestätigung eines falschen Ausbruchs)
- C3 dreht die FVG-Lücke und schließt unterhalb des Eröffnungskurses von C1 (Bestätigung der Umkehr)
Diese Logik ist weitaus raffinierter als einfache Unterstützungs-/Widerstands-Breakouts. Sie wartet nicht auf einen Ausbruch, sondern antizipiert die Umkehr nach einem gescheiterten Ausbruch.
Optimierungsspielraum: 5 Ausnahmeschalter, um das Potenzial auszuschöpfen
Der Code bietet fünf Ausnahmeschalter, mit denen du die Strategie an die Marktgegebenheiten anpassen kannst:
- EMA-Filter deaktivieren: Kann in Seitwärtsmärkten aktiviert werden
- Erlauben, dass C3 innerhalb der FVG schließt: Erhöht die Einstiegsmöglichkeiten, senkt aber die Signalqualität
- Erlauben, dass C3 den Eröffnungskurs von C1 durchbricht: Aggressivere Einstiegsbedingung
- Erlauben eines gegensätzlichen Schlusses von C2: Lockerung der Richtungsanforderung von C2
- Zeitfensterfilter: Begrenzung der Handelszeiten, um illiquide Phasen zu vermeiden
Praxistipps: Wann die Strategie einsetzen und wann nicht
Das beste Marktumfeld: Gerichtete Trendmärkte, insbesondere der zweite Einstieg nach einem Pullback nach einem Ausbruch. In diesem Umfeld kann die Trefferquote über 65 % liegen, das durchschnittliche Risiko-Ertrags-Verhältnis liegt nahe 2,5.
Unbedingt vermeiden: Seitwärtsmärkte. Wenn der Kurs wiederholt um den EMA schwankt, häufen sich die FVG-Signale, sie sind aber qualitativ sehr schlecht. Es wird empfohlen, die Strategie zu pausieren, wenn der ATR unter dem 20-Perioden-Durchschnitt liegt.
Risikohinweis: Historische Backtests garantieren keine zukünftigen Gewinne; die Strategie birgt das Risiko von Verlustserien. Es wird empfohlen, das Risiko pro Trade auf 1-2 % des Kontos zu begrenzen und die Stop-Loss-Disziplin strikt einzuhalten. Die Performance variiert stark in unterschiedlichen Marktumgebungen; eine kontinuierliche Überwachung und Anpassung sind erforderlich.
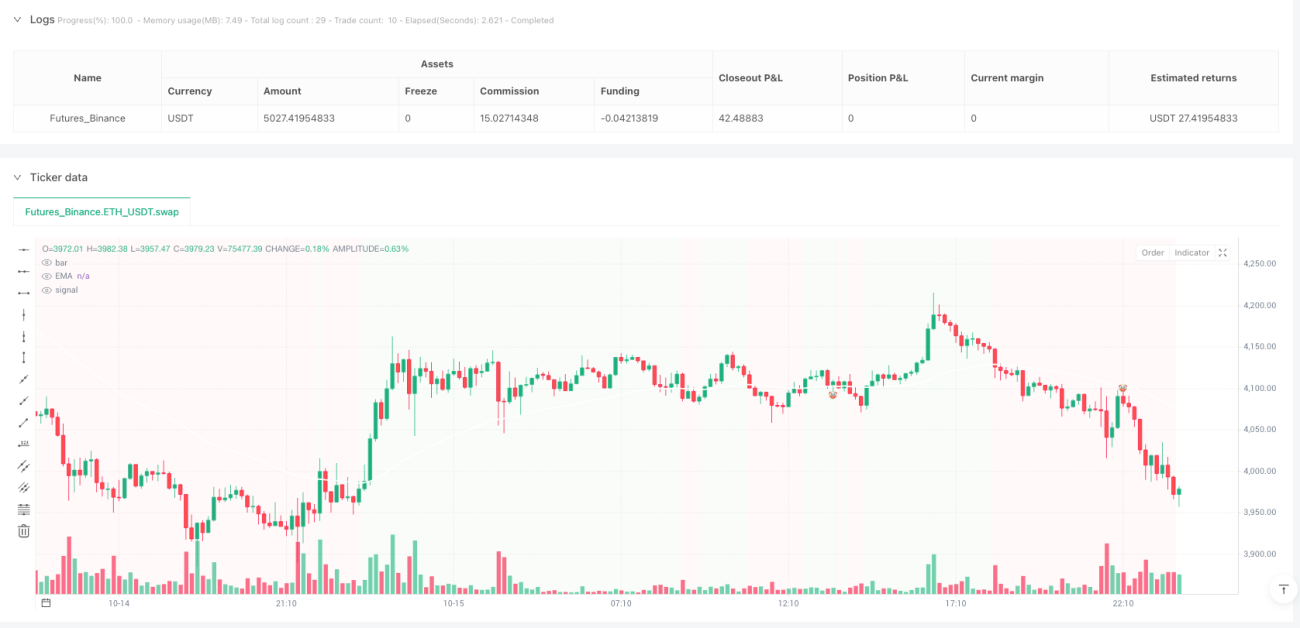
/*backtest
start: 2025-09-23 00:00:00
end: 2025-10-16 00:00:00
period: 10m
basePeriod: 10m
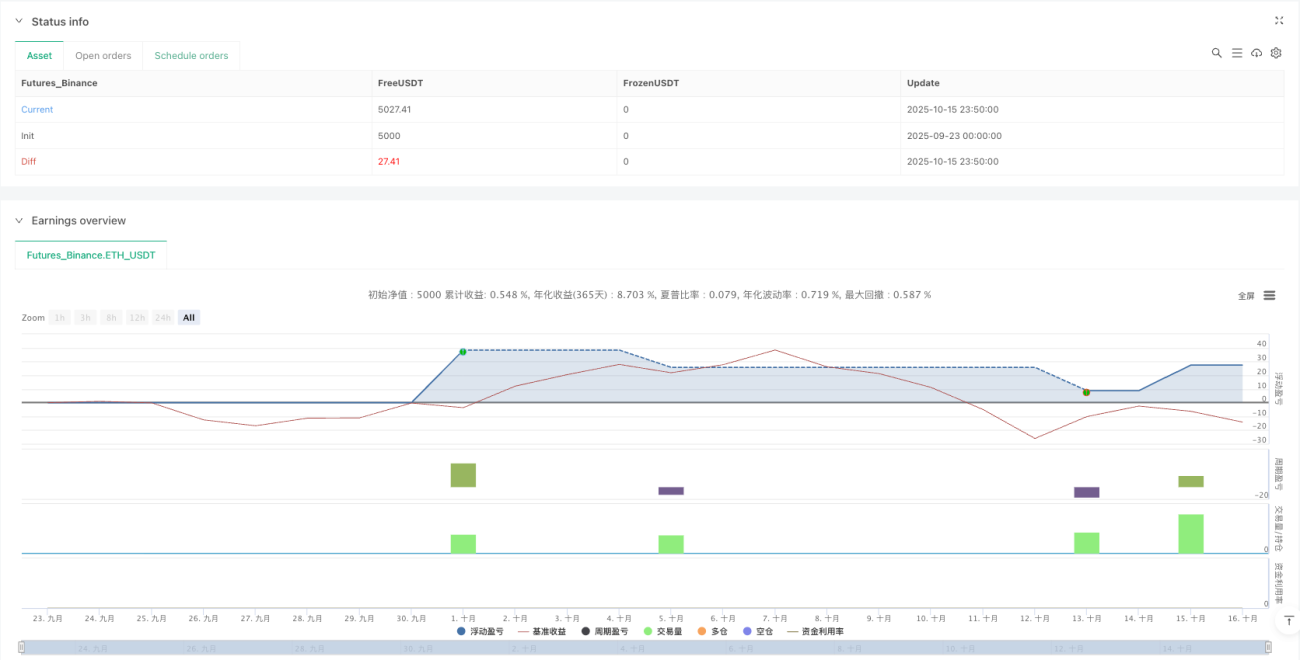
exchanges: [{"eid":"Futures_Binance","currency":"ETH_USDT","balance":5000}]
*/
// This Pine Script® code is subject to the terms of the Mozilla Public License 2.0 at https://mozilla.org/MPL/2.0/
// © rdjxyz
//@version=5- 1