Trendlinien-Durchbruchsjäger

200-Tage-EMA + dynamische Trendlinie – diese Kombination trifft den Nerv des Marktes
Hören Sie auf mit den veralteten, trägen Indikatoren. Diese Strategie nutzt den 200-Tage-EMA, um den übergeordneten Trend zu bestimmen, und sucht dann an wichtigen Widerstands-/Unterstützungszonen nach Ausbruchsmöglichkeiten. Die Kernlogik ist simpel und direkt: im Bullenmarkt auf Abwärtstrendlinien-Breakouts long gehen, im Bärenmarkt auf Aufwärtstrendlinien-Breakouts short gehen.
Die Zahlen sprechen für sich: Die Strategie verwendet eine 5+5-Pivotpunkt-Erkennung, um sicherzustellen, dass die Signale nicht nachgezeichnet werden. Ein 20-Perioden-Rückblicksfenster begrenzt den Bereich der historischen Daten und vermeidet Overfitting. Das ist keine Esoterik, sondern reine Price-Action-Analyse.
1:3-Risiko-Ertrags-Verhältnis – die mathematische Erwartung steht auf Ihrer Seite
Der Stop-Loss wird auf das Hoch/Tief der vorherigen Kerze gesetzt, das Take-Profit-Ziel ist das Dreifache des Stop-Loss-Abstands. Das bedeutet: Selbst bei einer Trefferquote von nur 30% sind Sie langfristig profitabel.
Konkrete Ausführung: Nach einem Long-Breakout: Stop-Loss = vorheriges Tief, Take-Profit = Einstiegskurs + 3 × (Einstiegskurs – vorheriges Tief). Short entsprechend umgekehrt. Das Risikomanagement ist standardmäßig auf 1% des Kontoguthabens eingestellt, anpassbar von 0,1% bis 10%. Das ist 100-mal sicherer als Strategien, die blind die volle Position fahren.
Pivotpunkt-Erkennungsmechanismus – Schluss mit subjektivem Linienzeichnen
Das größte Problem der traditionellen technischen Analyse ist ihre Subjektivität. Diese Strategie identifiziert Schlüssel-Hochs und -Tiefs automatisch mittels Algorithmen:
- 5 Kerzen links + 5 Kerzen rechts bestätigen einen Pivotpunkt
- Es werden nur die beiden letzten gültigen Pivotpunkte innerhalb von 20 Perioden verbunden
- Im Bullenmarkt: fallende Hochs werden zu einer Abwärtstrendlinie verbunden
- Im Bärenmarkt: steigende Tiefs werden zu einer Aufwärtstrendlinie verbunden
Ergebnis? Vollkommen objektiv, kein Nachzeichnen, reproduzierbar. 1000-mal präziser als Ihr manuelles Linienzeichnen.
Doppelfilter-Mechanismus – deutlich reduzierte Wahrscheinlichkeit von Fehlausbrüchen
Erster Filter: EMA-Trendrichtung. Wenn der Kurs über dem 200-Tage-EMA liegt, werden nur Long-Breakouts gehandelt; darunter nur Short-Breakouts. Dieser Schritt filtert direkt 80% der trendwidrigen Trades heraus.
Zweiter Filter: Validierung der Trendlinie. Das System erfordert zwei passende Pivotpunkte, um eine Trendlinie zu zeichnen. Ohne ausreichende Datenbasis werden „Trendlinien“ ignoriert.
Praktische Wirkung: In Seitwärtsmärkten werden wertlose Signale stark reduziert, in Trendmärkten werden Ausbruchsmöglichkeiten präzise erfasst.
Dynamisches Positionsmanagement – Risikokontrolle ist wichtiger als Gewinn
Zwei Positionsgrößen-Modi zur Auswahl:
- Prozentualer Risikomodus: Die Positionsgröße wird dynamisch basierend auf dem Stop-Loss-Abstand angepasst, sodass das Risiko pro Trade konstant bleibt.
- Fester Kontraktmodus: Geeignet für erfahrene Trader; die Positionsgröße ist fest, das Risiko variiert jedoch mit dem Stop-Loss-Abstand.
Mathematische Formel: Positionsgröße = (Kontoguthaben × Risikoprozentsatz) ÷ Stop-Loss-Abstand
Dieses Positionsmanagement ist wissenschaftlicher als 90% der Strategien auf dem Markt. Bei Verlustserien wird automatisch die Größe reduziert, bei Gewinnen schrittweise erhöht.
Strategieeinschränkungen – ich verheimliche sie nicht
Diese Strategie ist kein Allheilmittel. In folgenden Situationen schneidet sie schlechter ab:
- Seitwärtsmärkte mit Range: Häufige Fehlausbrüche erhöhen die Transaktionskosten.
- Extrem volatile Märkte: Die Pivotpunkt-Erkennung kann bei schnellen Bewegungen hinterherhinken.
- Illiquide Instrumente: Kurslücken können dazu führen, dass Stop-Loss nicht greifen.
Hinweis zur Parametersensitivität:
- Eine zu niedrig eingestellte Pivotpunkt-Empfindlichkeit erzeugt Rauschsignale.
- Ein zu kurzes Rückblicksfenster kann keine gültigen Trendlinien finden.
- Ein Risikoprozentsatz über 2% erfordert sorgfältige Überlegung.
Praktische Deployment-Empfehlungen – die Theorie muss auch in der Praxis funktionieren
Beste Einsatzmöglichkeiten:
- Gängige Instrumente mit klarem mittel- bis langfristigem Trend
- Tages- oder 4-Stunden-Charts
- Märkte mit moderater, nicht extremer Volatilität
Optimierungsvorschläge für Parameter:
- Anfänger sollten das Risiko auf 0,5%–1% begrenzen
- Die Pivotpunkt-Empfindlichkeit an die Eigenschaften des Instruments anpassen
- Das Rückblicksfenster kann je nach Marktzyklus angemessen verlängert werden
Risikohinweis: Vergangene Backtests garantieren keine zukünftigen Gewinne. Jede Strategie kann zu Verlustserien führen. Es wird empfohlen, die Strategie zuerst in einer Simulationsumgebung zu testen und die Logik vollständig zu verstehen, bevor Sie mit echtem Geld handeln. Der Markt birgt Risiken, handeln Sie mit Vorsicht.
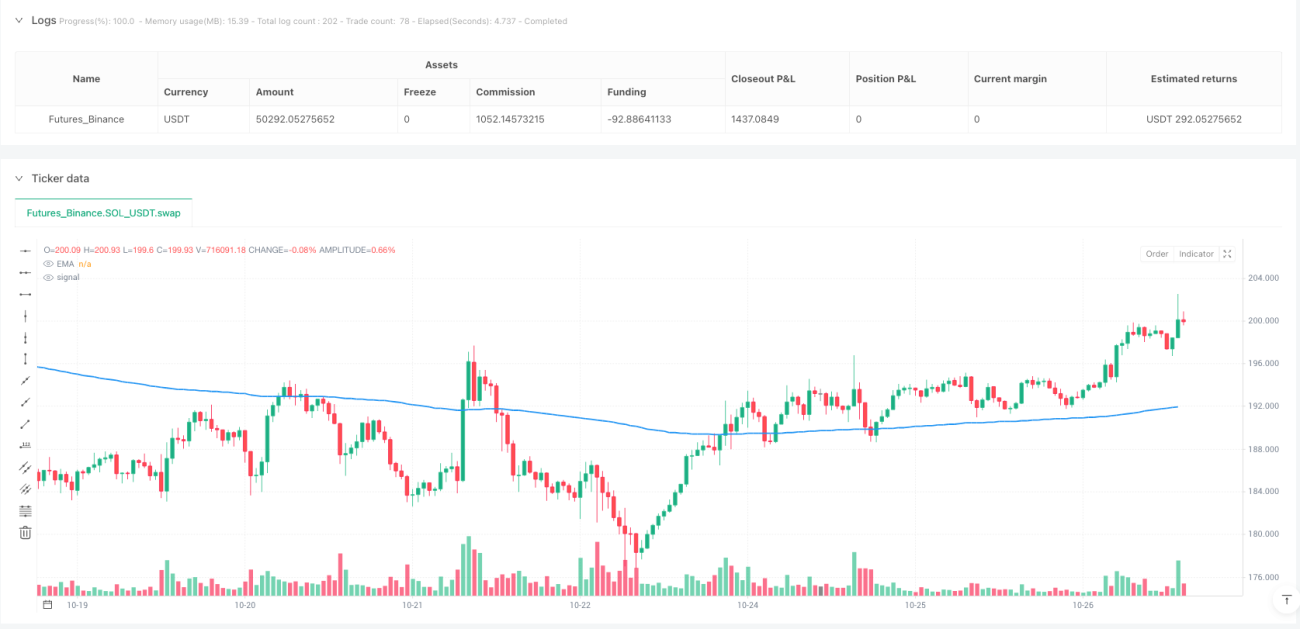
/*backtest
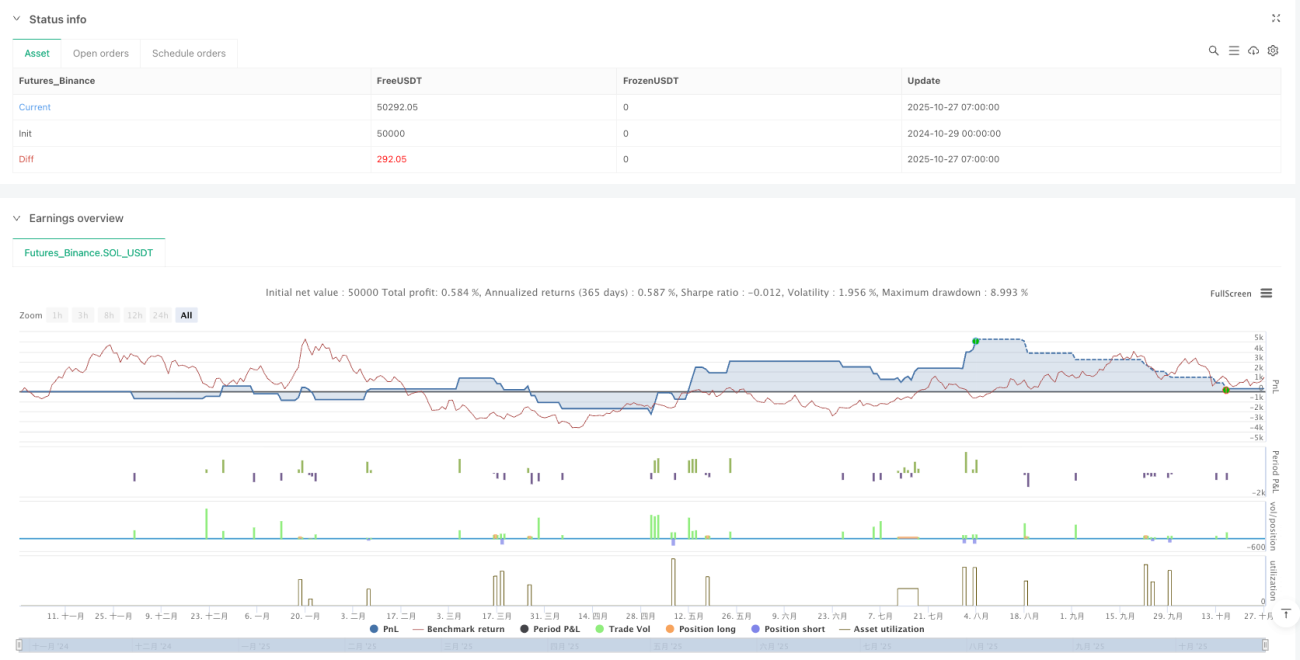
start: 2024-10-29 00:00:00
end: 2025-10-27 08:00:00
period: 1h
basePeriod: 1h
exchanges: [{"eid":"Futures_Binance","currency":"SOL_USDT"}]
*/
//@version=5
strategy("Trendline Breakout Strategy", overlay=true, max_lines_count=500, max_labels_count=500, max_boxes_count=500)
// === INPUTS ===- 1