Gold-Liquiditätsjäger-Strategie

🎯 Was macht diese Strategie eigentlich?
Wusstest du, dass es im Markt eine Gruppe von „Smart Money" gibt, die immer wieder Fallen an Schlüsselpositionen aufbaut? Diese Strategie funktioniert wie ein erfahrener Jäger, der genau diese Fallen erkennt und gegenläufig handelt. Einfach gesagt: Wenn der Kurs absichtlich eine wichtige Unterstützungs- oder Widerstandszone „falsch durchbricht" und dann schnell wieder zurückkommt, steigen wir im Takt des großen Geldes ein!
📊 Enthüllung des Dreifach-Filtersystems
Wichtig! Diese Strategie verwendet drei Schutzebenen:
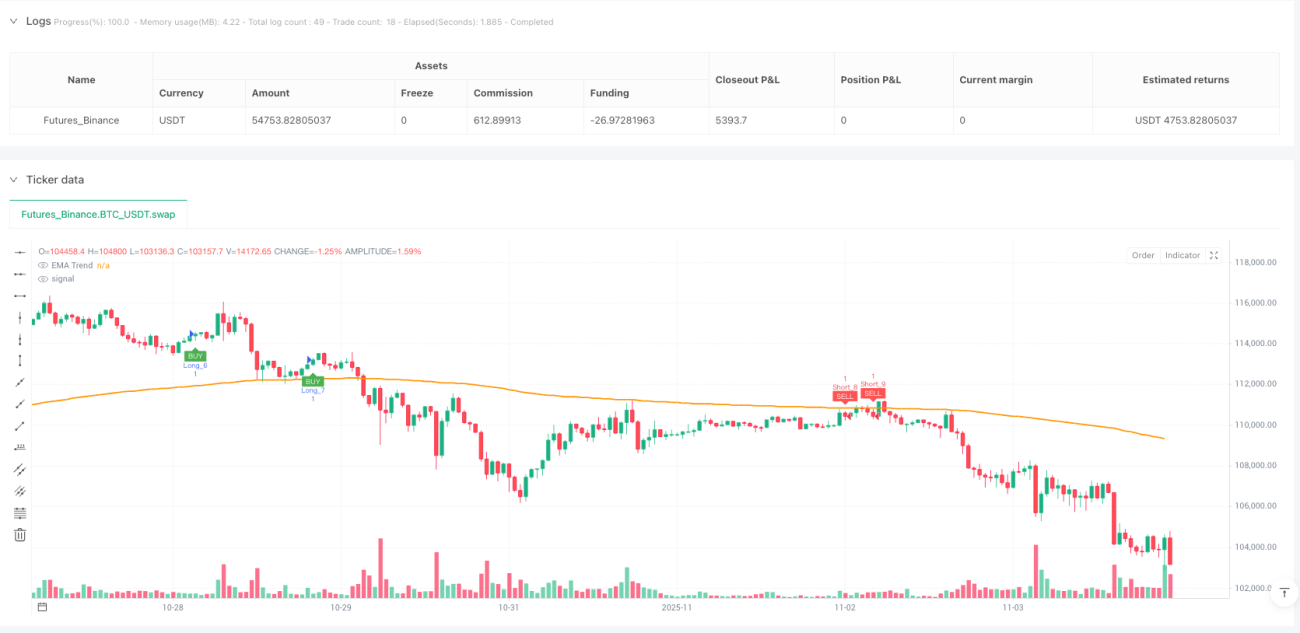
🔸 Trendfilter: Der 200-Perioden-EMA ist wie ein erfahrener Fahrer, der dir sagt, ob es bergauf oder bergab geht.
🔸 Schlüsselzonen-Erkennung: Automatische Identifizierung der „umkämpften" Unterstützungs- und Widerstandszonen.
🔸 Liquiditäts-Sweep-Erkennung: Erfasst die absichtlich erzeugten „Finte" des großen Geldes.
Wie beim Angeln musst du wissen, wo die Fische sind, welchen Köder du verwendest und wann du den Haken setzt!
🎪 Die magische Anziehungskraft des Liquiditäts-Sweeps
Stell dir vor: Du stehst in der Schlange für einen Bubble Tea, plötzlich ruft jemand: „Gratis!" Alle stürmen hin, aber es stellt sich als Fake heraus. Der Kluge hat sich trotzdem in die Schlange vorgedrängelt.
Genauso verhält es sich im Markt! Der Kurs „tut so", als würde er eine Unterstützung durchbrechen (um Stop-Loss-Orders auszulösen), und kehrt dann schnell zurück. Das ist der perfekte Einstiegszeitpunkt. Die Strategie verwendet einen Puffer von 0,6 ATR, um sicherzustellen, dass es sich wirklich um einen „Sweep" und nicht um einen echten Ausbruch handelt.
⚡ Risikomanagement: Das goldene Verhältnis von 1:2
Vermeidungsleitfaden: Viele Leute handeln, als würden sie ohne Sicherheitsgurt Auto fahren. Diese Strategie erzwingt ein Risiko-Ertrags-Verhältnis von 1:2!
- Stop-Loss: 0,5 ATR unterhalb der Schlüsselzone
- Take-Profit: 2-fache Entfernung des Stop-Loss
- Selbst bei nur 40% Gewinnquote ist langfristig ein Gewinn möglich!
🚀 Praktische Anwendungstipps
Diese Strategie eignet sich am besten für den 15-Minuten-Zeitraum beim Goldhandel. Warum? Weil der Goldmarkt liquide ist, falsche Ausbrüche häufig vorkommen und der 15-Minuten-Zeitraum zu viel Rauschen herausfiltert.
Denk dran: Sei nicht gierig! Die Strategie hat dir eine gute Position gefunden – den Rest überlässt du dem Markt und der Zeit.
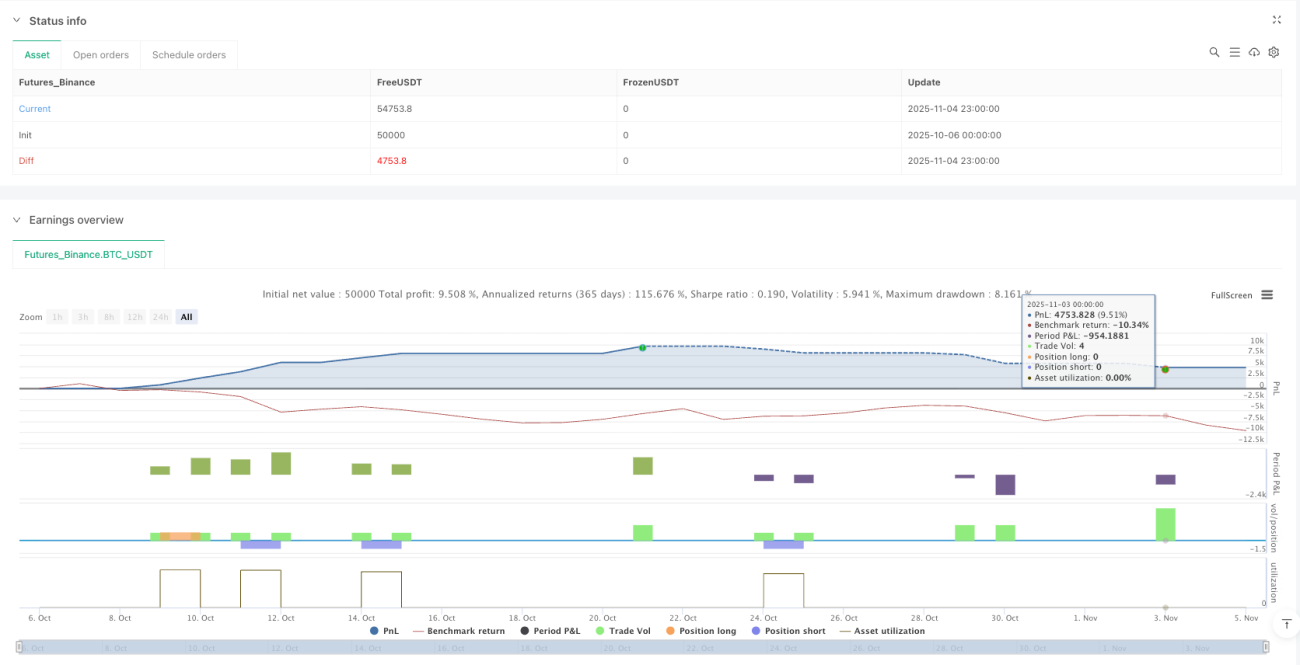
/*backtest
start: 2025-10-06 00:00:00
end: 2025-11-05 00:00:00
period: 1h
basePeriod: 1h
exchanges: [{"eid":"Futures_Binance","currency":"BTC_USDT"}]
*/

//@version=6
strategy("Gold 15m: Trend + S/R + Liquidity Sweep (RR 1:2)", overlay=true, default_qty_type=strategy.fixed, default_qty_value=1, commission_type=strategy.commission.percent, commission_value=0.0)

// ---------------------- INPUTS ----------------------- 1