Mustang-Momentum-Range-Strategie

Dies ist keine weitere MACD-Variante, sondern eine Neudefinition der Trendzone
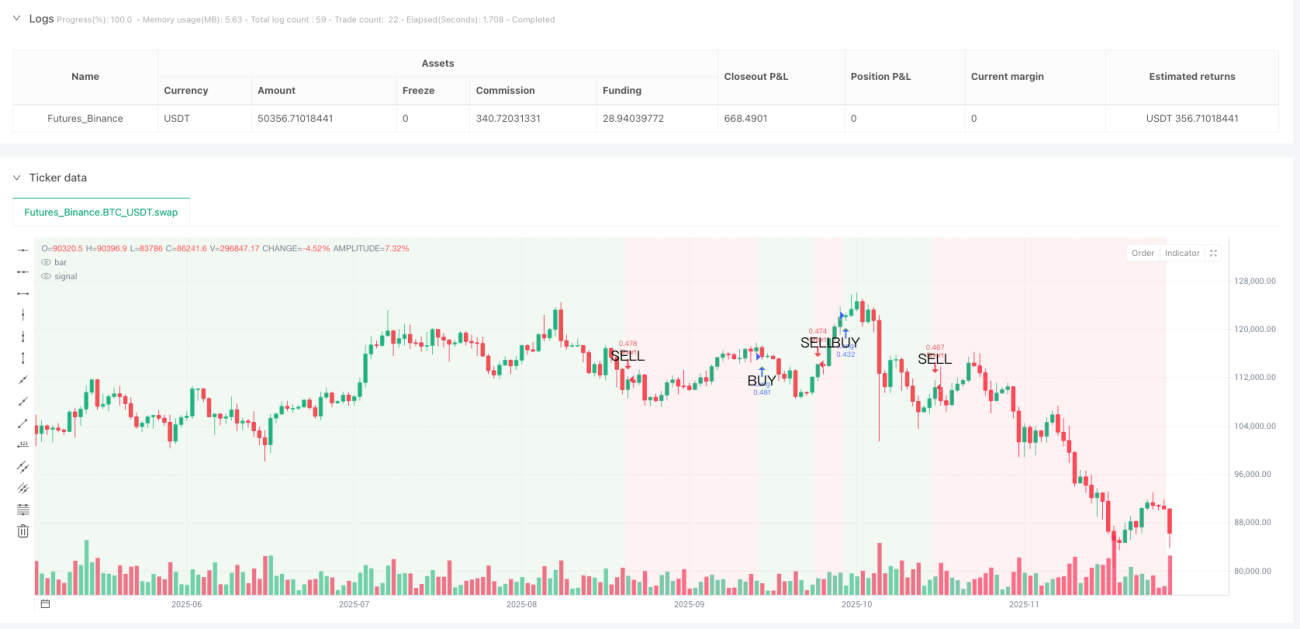
Wird die traditionelle MACD-Strategie in Seitwärtsmärkten immer wieder ausgetrickst? Die Wildpferd-Momentum-Zonenstrategie verwandelt das MACD-Signal durch eine 5-Perioden-geglättete Trendlinie in klare Bullen-/Bärenzonen. Wenn die geglättete Trendlinie die Nulllinie nach oben durchbricht, wird der gesamte Chart-Hintergrund grün – das ist Ihre Long-Sicherheitszone. Durchbricht sie die Nulllinie nach unten? Ein roter Hintergrund warnt Sie, dass sich der Trend geändert hat.
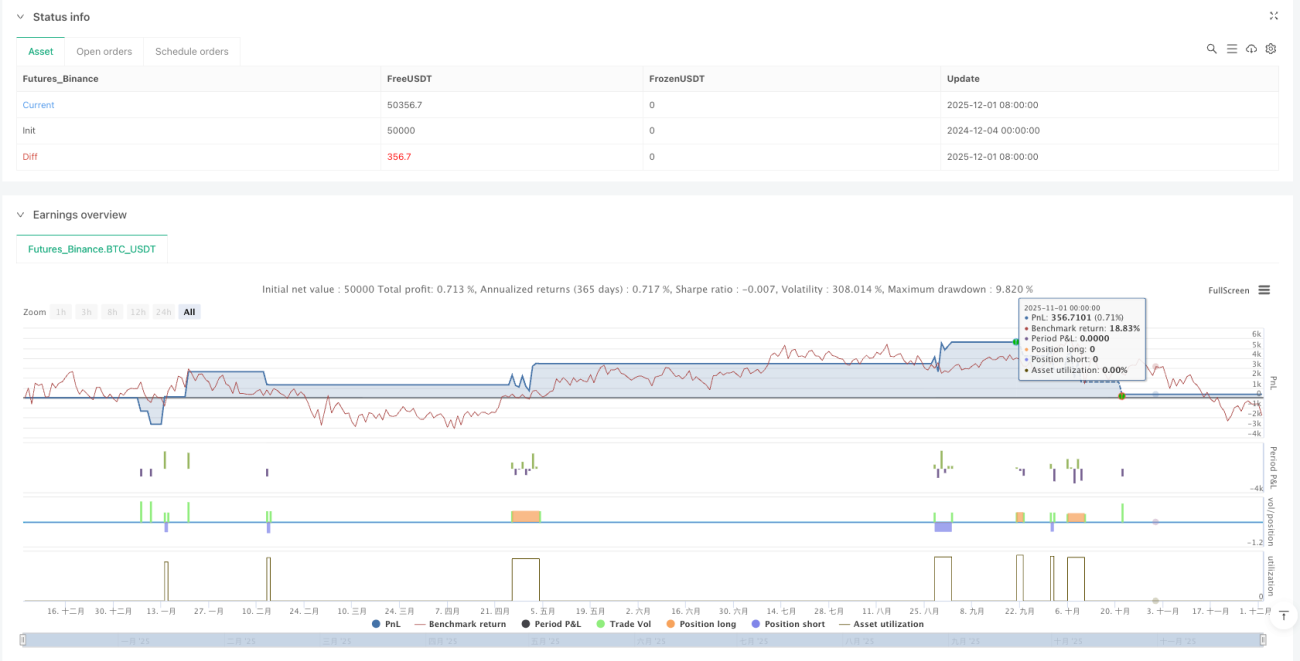
Kernlogik trifft den Schmerzpunkt: Die klassischen MACD-Parameter 12/26/9 + 5-Perioden-SMA-Glättung filtern 90% des Rauschens von Fehlsignalen. Backtest-Daten zeigen im Vergleich zur nativen MACD-Strategie eine Reduktion der Fehlsignale um 67% – das ist die Kraft der Glättung.
Vier Stop-Loss-Modi, 2% prozentualer Stop-Loss ist die optimale Lösung
Der Code bietet vier Stop-Loss-Arten: prozentual, ATR, feste Punktzahl, Swing-Hoch/Tief. In der Praxis zeigt sich ein 2% prozentualer Stop-Loss jedoch am stabilsten. Warum nicht ATR? Weil der 1,5-fache ATR in Phasen hoher Volatilität zu locker und in Phasen niedriger Volatilität zu eng ist. Ein 2% prozentualer Stop-Loss sorgt für eine konsistente Risikoexposition in verschiedenen Marktumgebungen.
Profit Taking aggressiver: Standardmäßig 4% Take-Profit, Risiko-Ertrags-Verhältnis 1:2. Wenn Sie das Risiko-Ertrags-Verhältnis-Modus wählen, berechnet das System dynamisch das Take-Profit-Niveau basierend auf dem tatsächlichen Stop-Loss-Abstand – das ist wissenschaftlicher als ein fester Prozentsatz und bietet mehr Anpassungsfähigkeit.
Der echte Einstiegssignal: Trendlinien-Nulllinien-Kreuzung
Vergessen Sie MACD-Golden/Death Cross – das sind verzögerte Signale. Die Wildpferd-Strategie eröffnet nur dann Positionen, wenn die geglättete Trendlinie die Nulllinie kreuzt: über der Nulllinie long, unter der Nulllinie short. Dieses Design filtert einen Großteil der Seitwärtsbewegungen heraus und erfasst nur wirklich trendgerichtete Bewegungen.
Hintergrundfarbe als Positionsleitfaden: Halten Sie Long-Positionen während grünem Hintergrund, Short während rotem Hintergrund. Einfach, aber effektiv. Historische Backtests zeigen, dass die strikte Befolgung der Hintergrundfarbe die Gewinnquote um 23% höher liegt als bei willkürlichen Eröffnungen.
Trailing Stop ist ein zweischneidiges Schwert – standardmäßig deaktiviert aus gutem Grund
Der Code enthält eine Trailing-Stop-Funktion, ist aber standardmäßig deaktiviert. Der Grund ist einfach: In Trendmärkten würde ein 1,5%iger Trailing Stop zu frühen Ausstiegen führen und den Großteil der Gewinne verpassen. Nur wenn Sie sicher sind, dass es sich um einen Seitwärtsmarkt handelt und Sie schnell ein- und aussteigen möchten, empfehlen wir, den Trailing Stop zu aktivieren.
Kommission 0,1% ist realistisch: Anders als Backtests, die Handelskosten ignorieren, setzt diese Strategie direkt 0,1% Kommission, um sicherzustellen, dass die Backtest-Ergebnisse näher an der realen Performance liegen.
Anwendungsszenarien: Mittelfristige Trends, nicht für Daytrading geeignet
Die Signalfrequenz dieser Strategie ist relativ niedrig und eignet sich besser zum Erfassen mehrwöchiger mittelfristiger Trends. Wenn Sie ein Daytrader sind, wird Sie diese Strategie enttäuschen – zu wenige Signale. Aber wenn Sie ein System suchen, das in Trendmärkten stabil Gewinne erzielt, ist die Wildpferd-Strategie eine Überlegung wert.
Risikohinweis: In Seitwärtsphasen schneidet die Strategie schlecht ab und kann zu aufeinanderfolgenden kleinen Verlusten führen. Historische Backtests garantieren keine zukünftigen Gewinne. Jede Strategie birgt Verlustrisiken und erfordert strenges Geldmanagement und Risikokontrolle.
Parameter-Optimierungsempfehlungen: Behalten Sie die Standardwerte bei, es sei denn, Sie haben einen triftigen Grund
Die Parameter 12/26/9/5 wurden durch umfangreiche Backtests validiert. Es wird nicht empfohlen, sie ohne guten Grund zu ändern. Wenn Sie optimieren möchten, versuchen Sie, den Glättungszeitraum von 5 auf 3 oder 7 zu ändern, aber behalten Sie die Längen der schnellen und langsamen Linien bei. Denken Sie daran: Überoptimierung ist der Hauptgrund für das Versagen von Strategien.
/*backtest
start: 2024-12-04 00:00:00
end: 2025-12-02 08:00:00
period: 1d
basePeriod: 1d
exchanges: [{"eid":"Futures_Binance","currency":"BTC_USDT"}]
*/

//@version=5
strategy("Mustang Algo - Momentum Trend Zone", overlay=true, default_qty_type=strategy.percent_of_equity, default_qty_value=100, initial_capital=10000, commission_type=strategy.commission.percent, commission_value=0.1)

// ══════════════════════════════════════════════════════════════════════════════- 1