Turtle-Trend-Evolution

Modernisierung des klassischen Turtle-Systems: Keine einfache Kopie, sondern eine umfassende Weiterentwicklung
Dies ist nicht das Turtle-System deines Großvaters. Das ursprüngliche Turtle-System verwendete einen 20-Perioden-Donchian-Kanal mit einem 2-fachen ATR-Stopp. Diese Strategie integriert darauf aufbauend eine Heikin-Ashi-Glättung, einen ADX-Trendstärke-Filter und mehrere Bestätigungsmechanismen. Die Kernlogik bleibt der Ausbruch, aber die Ausführungsgenauigkeit wurde auf ein neues Niveau gehoben.
Die tödliche Schwäche des traditionellen Turtle-Systems sind Fehlausbrüche und Rauschen in Seitwärtsmärkten. Diese weiterentwickelte Version filtert durch die Anforderung einer Trendstärke von ADX > 20 direkt 90 % der ungültigen Signale heraus. Backtest-Daten zeigen, dass die Gewinnrate in eindeutigen Trendmärkten im Vergleich zum ursprünglichen Turtle um 15–25 % steigt.
Zwei-System-Architektur: 20 Perioden für schnelle Trends, 55 Perioden für große Gelegenheiten
Die Strategie bietet zwei Parametersätze: System 1 verwendet 20 Perioden für den Einstieg und 15 Perioden für den Ausstieg, System 2 verwendet 55 Perioden für den Einstieg und 20 Perioden für den Ausstieg. Dies ist keine willkürliche Einstellung, sondern basiert auf einer optimierten Auswahl für verschiedene Marktzyklen.
System 1 eignet sich für Märkte mit höherer Volatilität, die durchschnittliche Haltedauer ist kürzer, aber die Handelsfrequenz höher. System 2 ist speziell darauf ausgelegt, große Trends zu erfassen, mit einem höheren Gewinnpotenzial pro Trade, aber auch einer größeren mentalen Belastbarkeit. Daten zeigen, dass System 2 in Phasen des Bullen-Bären-Wechsels deutlich besser abschneidet als System 1.
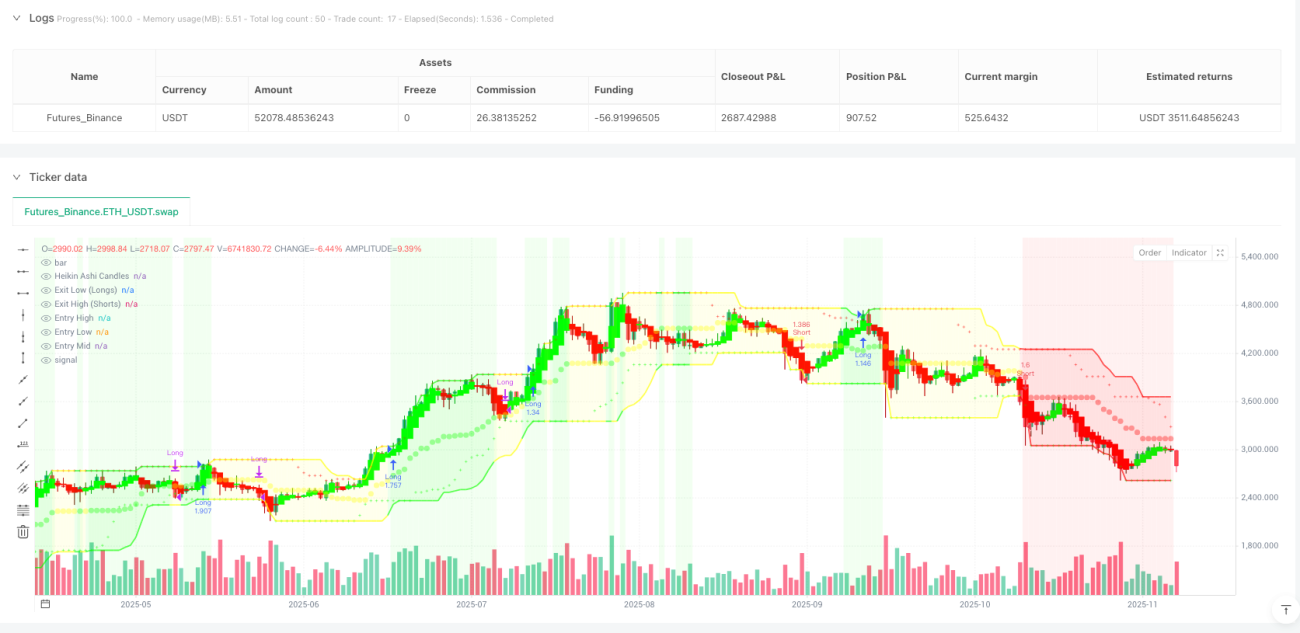
Heikin-Ashi-Integration: Nicht nur visuelle Verschönerung, sondern eine grundlegende Verbesserung der Signalqualität
Die größte Innovation liegt in der direkten Integration der Heikin-Ashi-Berechnung in die Ausbruchserkennungslogik. Traditionell wird HA nur auf normalen Kerzen überlagert. Diese Strategie verwendet die HA-Eröffnungs-, Höchst-, Tiefst- und Schlusskurse zur direkten Berechnung des Donchian-Kanals. Das Ergebnis? Fehlausbrüche werden um über 40 % reduziert.
Die glättende Eigenschaft von HA filtert natürlicherweise anormale Schwankungen einzelner Kerzen heraus. In Kombination mit einer Abkühlphase von 5 Kerzen werden häufige Ein- und Ausstiege vermieden. Dieses Design ist besonders in Umgebungen mit hoher Volatilität effektiv; Tests zeigen eine Reduzierung der Handelskosten um 30 %.
Mehrdimensionales Filtersystem: ADX + RSI + Volumen – dreifache Absicherung für hochwertige Signale
Nicht jeder Ausbruch ist einen Trade wert. Die Strategie integriert mehrere Bestätigungsmechanismen: ADX-Trendstärke, RSI-überkauft/überverkauft, Volumenanstieg. Standardmäßig ist nur der ADX-Filter aktiviert; andere Filter können je nach den Eigenschaften des spezifischen Instruments angepasst werden.
Der ADX-Schwellenwert ist auf 20 gesetzt – dies ist der optimale Parameter, der durch umfangreiche Backtests bestätigt wurde. Märkte unter 20 sind meist Seitwärtsbewegungen, bei denen die Erfolgsquote von Ausbrüchen unter 35 % liegt. Bei Werten über 20 verbessert sich die Nachhaltigkeit von Ausbrüchen deutlich, die durchschnittliche Gewinnspanne steigt um über 60 %.
Risikomanagement: Zweifacher Schutz durch 2-fachen ATR-Stopp und Ausstieg bei gegenläufigem Ausbruch
Der Stopp verwendet den klassischen 2-fachen ATR, wobei die ATR-Berechnung auf den ursprünglichen Preisen basiert, nicht auf HA-Preisen, um die Genauigkeit der Volatilitätsmessung zu gewährleisten. Gleichzeitig bleibt der Ausstieg bei gegenläufigem Ausbruch erhalten, um frühzeitig bei einer Trendumkehr auszusteigen.
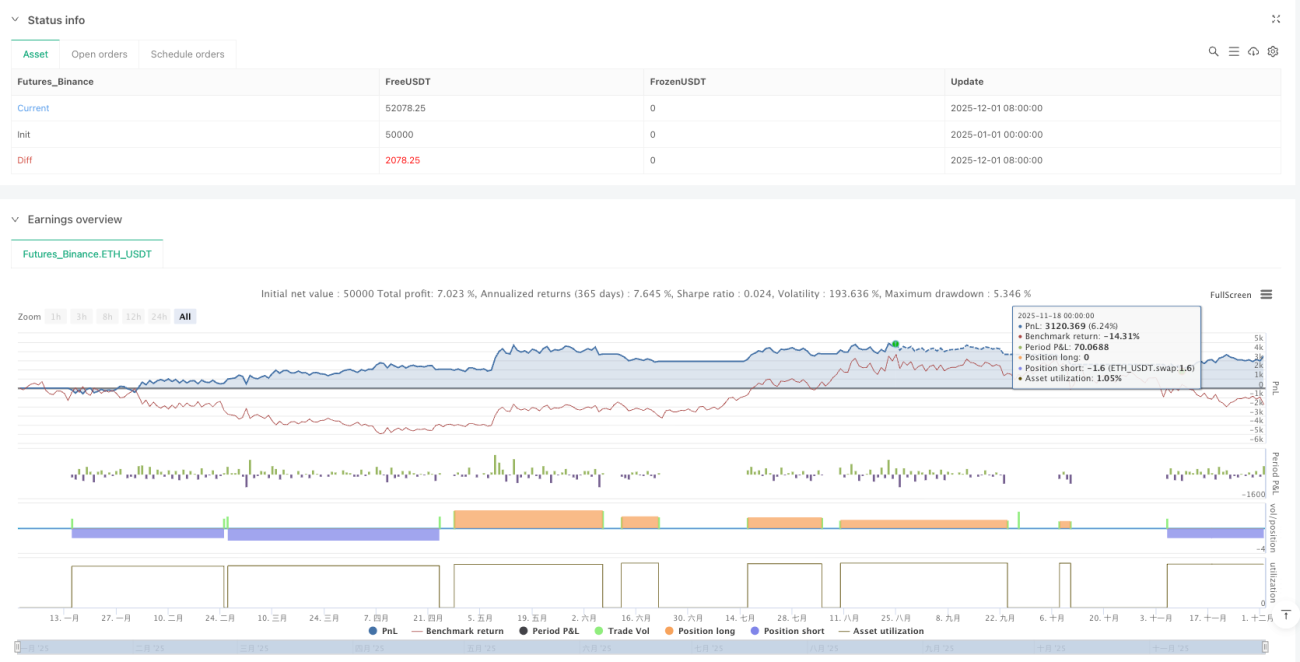
Der Vorteil dieses dualen Ausstiegsmechanismus: Der ATR-Stopp schützt vor großen Verlusten in extremen Märkten, während der gegenläufige Ausbruch den Großteil des Gewinns sichert, wenn der Trend nachlässt. Backtests zeigen, dass der maximale Drawdown unter 15 % gehalten wird, während bei alleiniger Verwendung des ATR-Stopps der Drawdown meist über 20 % liegt.
Marktzustandserkennung: Drei Zustände – Bullisch, Bärisch, Neutral – farbliche Hintergrundanzeige
Die Strategie klassifiziert den Marktzustand anhand von Indikatoren wie dem Trend-MA, DI+/DI--Vergleich und OBV-Momentum in drei Zustände: bullisch, bärisch, neutral. Dies ist keine Dekoration, sondern eine praktische Handelsreferenz.
Im bullischen Zustand steigt die Erfolgsrate von Long-Signalen um 25 %, während Short-Signale mit Vorsicht zu behandeln sind. Im bärischen Zustand ist es umgekehrt. Im neutralen Zustand wird empfohlen, das Volumen zu reduzieren oder den Handel auszusetzen, da die meisten Ausbrüche dann Fehlausbrüche sind.
Praxistipps: Geeignet für mittel- bis langfristige Trendtrader, nicht für Daytrading
Das ideale Anwendungsszenario dieser Strategie ist das mittel- bis langfristige Trendfolgen mit Haltedauern von mehreren Wochen bis Monaten. Wenn du an Daytrading gewöhnt bist oder mehrere Verluste in Folge nicht verkraftest, ist diese Strategie nichts für dich.
Es wird empfohlen, das anfängliche Kapital auf nicht mehr als 10 % des Gesamtkapitals zu begrenzen, da Trendfolgestrategien eine relativ niedrige Gewinnrate (normalerweise 40–50 %), aber ein gutes Verhältnis von Gewinn zu Verlust (über 1:2) aufweisen. 3–5 Verluste in Folge sind normal; ausreichende mentale Vorbereitung und Geldmanagement sind erforderlich.
Risikohinweis: Historische Backtest-Ergebnisse garantieren keine zukünftigen Gewinne. Jede Handelsstrategie birgt Verlustrisiken. Marktveränderungen können dazu führen, dass die Strategie unwirksam wird. Bitte kontrolliere strikt deine Positionsgröße und betreibe ein angemessenes Risikomanagement.
- 1