Super Trend V Strategy

Overview
The Super Trend V strategy is a short-term trading strategy based on moving averages and standard deviations. It uses the Super Trend indicator to determine the price trend direction and combines the support and resistance formed by moving averages to enter the market. Meanwhile, it uses the standard deviation channel to predict the potential support and resistance zones of the price and sets the stop loss and take profit price range to implement a trend-following and efficient-exiting short-term trading strategy.
Strategy Logic
Firstly, this strategy calculates the Super Trend indicator. The Super Trend indicator uses the relationship between ATR and price to determine the trend direction. When the price is above the rising trend, it is bullish. When the price is below the falling trend, it is bearish.
Then it calculates the EMA of price and the EMA of open price. When the price crosses above the EMA and is higher than the open price EMA, it is a buy signal. When the price crosses below the EMA and is lower than the open price EMA, it is a sell signal.
Next, it uses standard deviation to calculate the upper and lower bands of the price channel and makes smoothing processing. When the price breaks through the upper band of standard deviation, it is a stop loss signal. When the price breaks through the lower band of standard deviation, it is a take profit signal.
Finally, it combines moving averages of different timeframes to determine the trend direction, together with the Super Trend indicator, to form a stable trend judgment.
Advantages of the Strategy
- Use Super Trend indicator to determine the price trend direction, avoiding losses caused by trend reversal
- Moving averages combined with open price help determine entry timing, avoiding false breakdowns
- Standard deviation channel predicts potential support and resistance zones of the price for stop loss and take profit
- Multiple timeframes combination improves the stability of trend judgment
Risks of the Strategy
- Super Trend indicator has lagging effect, may miss trend change points
- Crossovers of moving averages have lagging effect, entry timing may not be accurate
- Range of standard deviation channel is too fixed to reflect market fluctuation in real time
- Judgment based on multiple timeframes may conflict with each other
Risk Management:
- Shorten Super Trend parameters properly to improve sensitivity
- Optimize moving average periods, or add other indicators to determine entry
- Adjust standard deviation channel dynamically to match the market
- Define clear logic for multi-timeframe judgments to handle conflicts
Optimization Directions
- Optimize Super Trend parameters to find the best combination
- Try other indicators combined with moving averages to determine entry
- Try dynamic adjustment of standard deviation channel
- Test different multi-timeframe combinations to find the best match
- Optimize stop loss and take profit strategies to improve profit space
Conclusion
The Super Trend V strategy integrates the advantages of trend, moving average, standard deviation channel and other indicators to achieve stable trend judgment, proper entry timing, and stop loss and take profit based on price zones. By optimizing parameters, indicators, stop loss and take profit, etc., it can improve the stability and profitability of the strategy. Its solid logic and rigorous thinking are worth learning and researching.
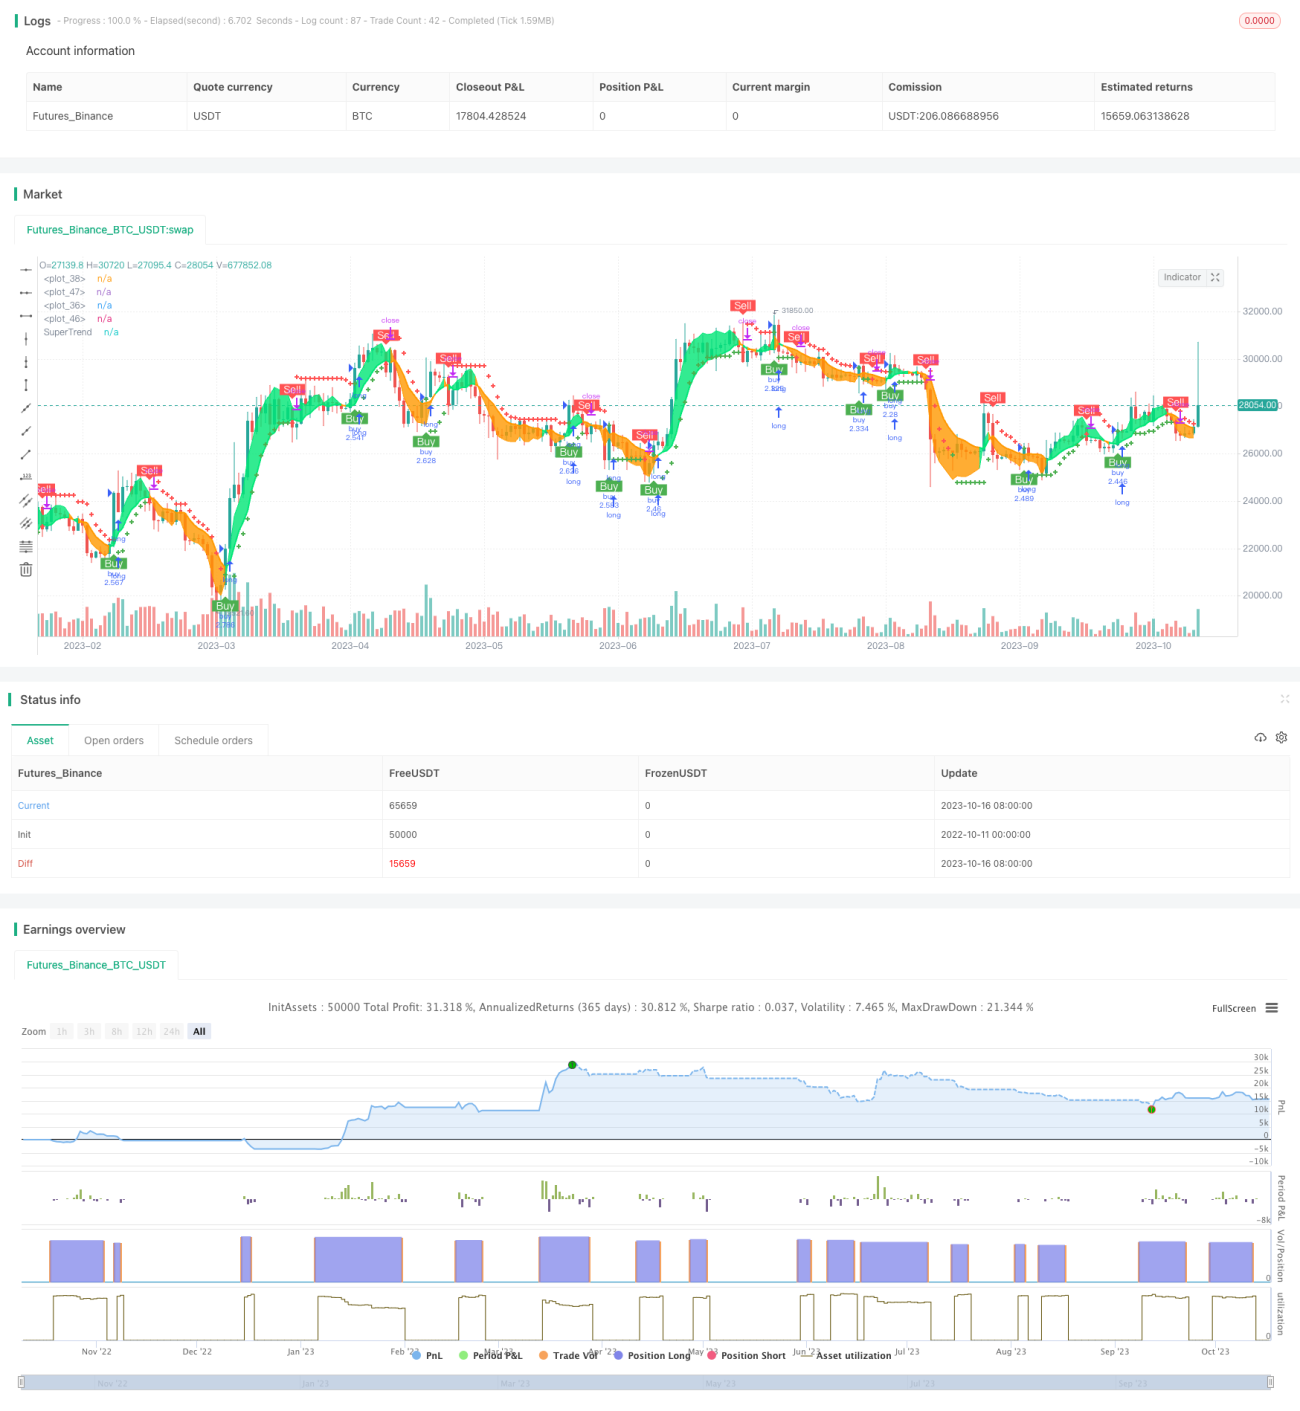
/*backtest
start: 2022-10-11 00:00:00
end: 2023-10-17 00:00:00
period: 1d
basePeriod: 1h
exchanges: [{"eid":"Futures_Binance","currency":"BTC_USDT"}]
*/

// © theCrypster 2020

//@version=4
strategy(title = "Super trend V Strategy version", overlay = true, pyramiding=1,initial_capital = 1000, default_qty_type= strategy.percent_of_equity, default_qty_value = 100, calc_on_order_fills=false, slippage=0,commission_type=strategy.commission.percent,commission_value=0.075)- 1