Parabolic SAR Dynamic Breakout Triple SMMA Strategy

Overview
This is a breakout trading strategy combining the parabolic SAR indicator and triple SMMA lines with different periods. It goes long when all three SMMA lines are rising and goes short when all are falling, while using the SAR indicator to determine the trend direction and taking counter trend entries when SAR flips directions. The strategy also incorporates stop loss and take profit.
Strategy Logic
The strategy is based on the following key points:
-
Using the parabolic SAR indicator to determine the current trend direction. SAR can dynamically track price changes and identify uptrends and downtrends.
-
Setting up three SMMA lines with different periods (fast line 21, mid line 50, slow line 200). When all three lines are rising, it signals an uptrend. When all are falling, it signals a downtrend.
-
Going long when SAR flips down while all three SMMA lines are rising.
-
Going short when SAR flips up while all three SMMA lines are falling.
-
Incorporating stop loss based on SAR and take profit at certain percentage of entry price.
Specifically, the strategy first checks if SAR flips directions on the current bar. If SAR flips from up to down while SMMAs are rising, it goes long. If SAR flips from down to up while SMMAs are falling, it goes short.
After entry, the stop loss is set at the SAR price on the next bar, using SAR as a dynamic trailing stop loss. Take profit is set at 10% of the entry price. When price reaches either take profit or stop loss levels, the position is closed.
Advantage Analysis
This strategy combines the advantage of a trend-following indicator and multiple time frame moving averages, allowing timely entries at trend reversals while filtering out false breaks with SMMAs. The main advantages are:
-
SAR can quickly detect trend changes and capture reversal opportunities.
-
The triple SMMAs effectively filter out market noise and avoid false breaks.
-
Using SMMA results in smoother curves and less interference from MA whipsaws.
-
Incorporating stop loss and take profit helps control single trade loss and lock in partial profits.
-
Flexible parameter settings allow optimization for different markets.
Risk Analysis
There are also some risks to consider:
-
SAR may flip frequently during choppy trends, increasing costs from excessive trading.
-
SMMA settings may not fit all instruments well, requiring individual optimization.
-
SAR stop loss has time lag, potentially increasing losses.
-
SAR may flip on false breaks in steady trends. Smoothening SAR parameters can help.
-
Poor SMMA settings may cause missed trends or bad signals. Careful testing is needed.
To address the risks, optimizations can focus on:
-
Adjusting SAR parameters based on volatility to reduce flips.
-
Tuning SMMA periods to fit instrument characteristics.
-
Improving stop loss, e.g. with trailing or limit orders.
-
Using limit orders for stop loss in active trading.
-
Extensive testing and tuning of parameters.
Optimization Directions
Based on the above analysis, optimizations may involve:
-
Optimizing SAR parameters for smoother curves and fewer flips.
-
Adjusting SMMA lengths to match trading instruments.
-
Employing dynamic stop loss like trailing stops or limit orders.
-
Using limit orders for stop loss in high-frequency trading.
-
Adding filters like RSI, KD to improve signal quality.
-
Improving entry conditions, e.g. checking candle patterns with SAR flips.
-
Adding re-entry conditions after stop loss triggers.
-
Enhancing take profit with trailing, partial close, staggering levels.
-
Parameter tuning based on backtest results and sensitivity analysis.
Summary
In summary, this is a simple and practical breakout strategy combining the sensitivity of SAR in catching trend changes and the filtering effect of moving averages. It can identify trend reversal points fast. The use of stop loss and take profit helps control risks and lock in profits. Further optimizations on parameter settings, entry/exit rules, and robustness against false breaks can enhance strategy performance for different trading instruments.
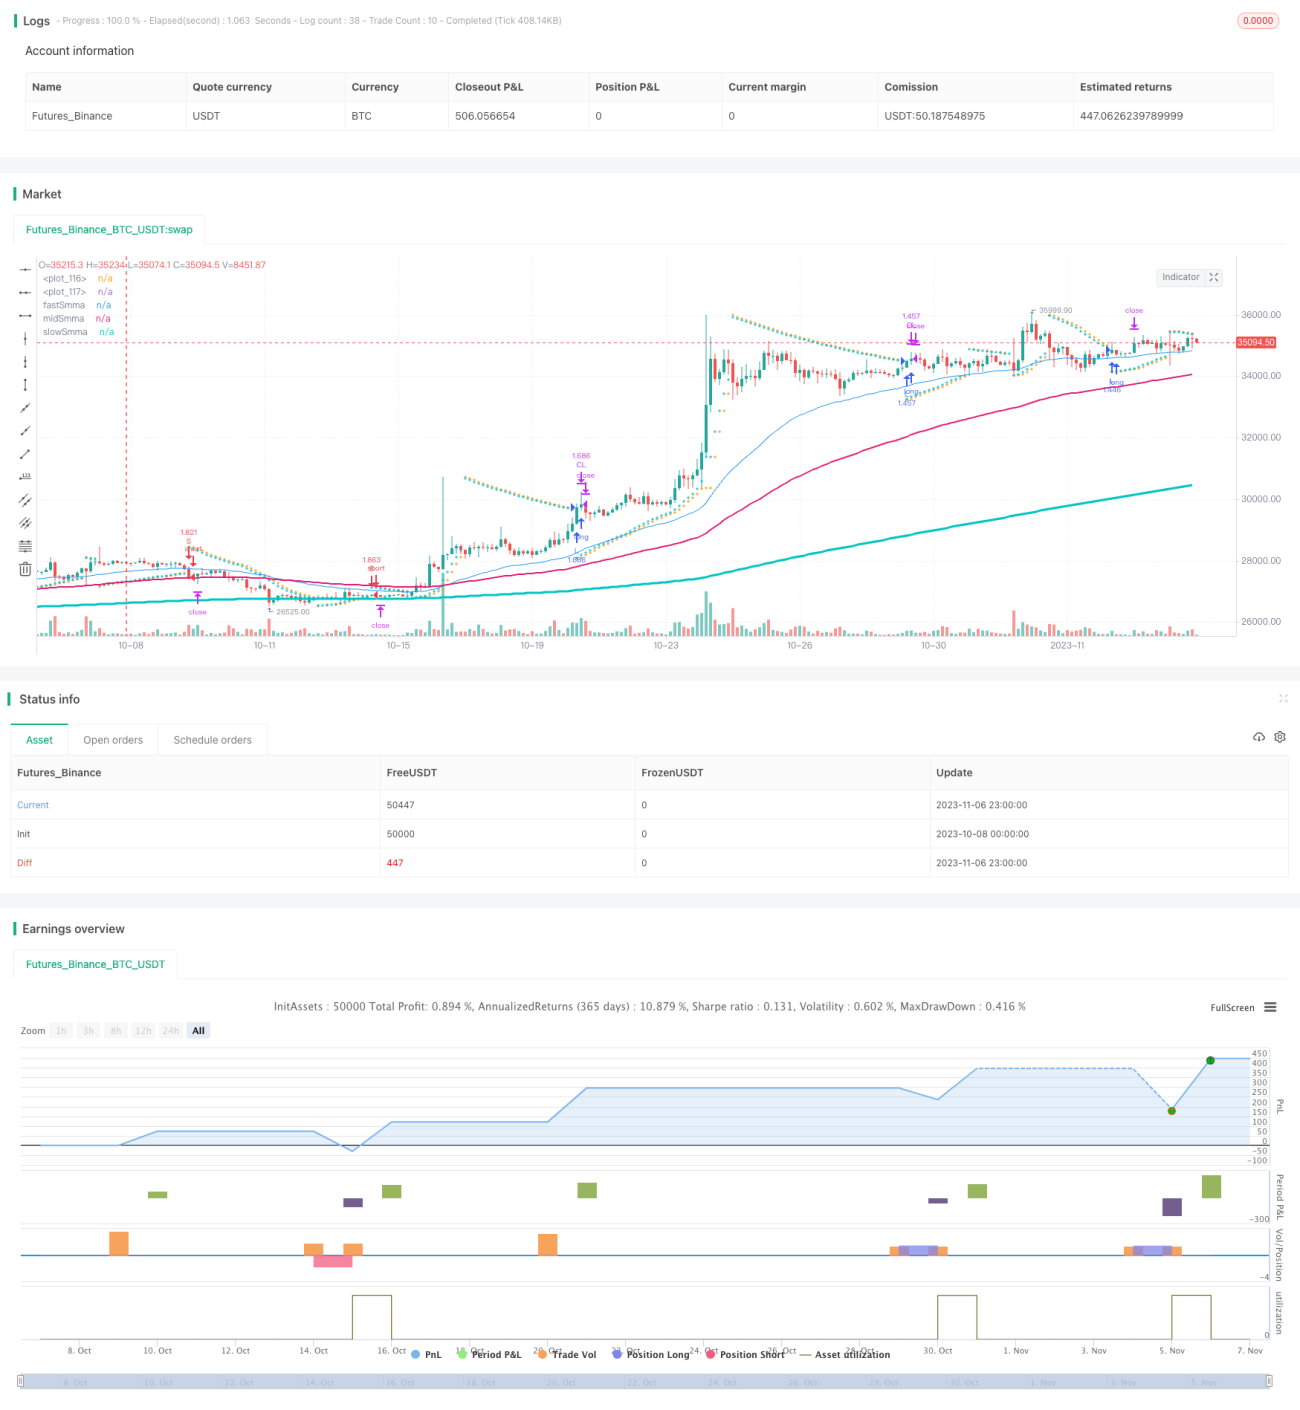
/*backtest
start: 2023-10-08 00:00:00
end: 2023-11-07 00:00:00
period: 3h
basePeriod: 15m
exchanges: [{"eid":"Futures_Binance","currency":"BTC_USDT"}]
*/

//@version=5
strategy(title="SAR + 3SMMA with SL & TP", overlay=true, calc_on_order_fills=false, calc_on_every_tick=false, default_qty_type=strategy.percent_of_equity, default_qty_value=100, currency=currency.USD, commission_type= strategy.commission.percent, commission_value=0.03)
start = input.float(0.02, step=0.01, group="SAR")
increment = input.float(0.02, step=0.01, group="SAR")- 1