
This is a trading strategy that utilizes moving average crossover patterns along with persistent uptrend to enter trades. When the fast MA crosses above the slow MA, a golden crossover signal is generated. If the uptrend persists after the crossover, a long position can be opened. When the price rallies to the stop loss or take profit levels, the position can be closed for stop loss or take profit.
The strategy is primarily based on moving average crossover for entry signals. Specifically, a fast MA (MA1) and slow MA (MA2) are defined. When MA1 crosses above MA2, it’s a signal to go long.
To avoid false signals from short-term crossovers, an angle threshold is added, so that a buy signal is only triggered when the MA2 angle is above a set threshold. This filters out some non-trending short-term rallies.
The strategy also sets a stop loss and take profit. The stop loss avoids losses in case of sudden market reversal, while take profit locks in profits. They are set as a percentage range from the entry price.
When price rallies to take profit point, the strategy will close long for profit taking. Also, if the rally is strong, the strategy will open a short position for mean reversion.
This is a simple and intuitive trend following strategy. The advantages are:
There are some risks to note:
Some ways to further optimize the strategy:
Overall this is a simple and practical trend following strategy. It has pros but also risks. Further refinements like parameter tuning, optimal indicators, stop loss settings etc. can improve it. But no strategy eliminates systemic risk fully. Risk management is key for prudent trading.
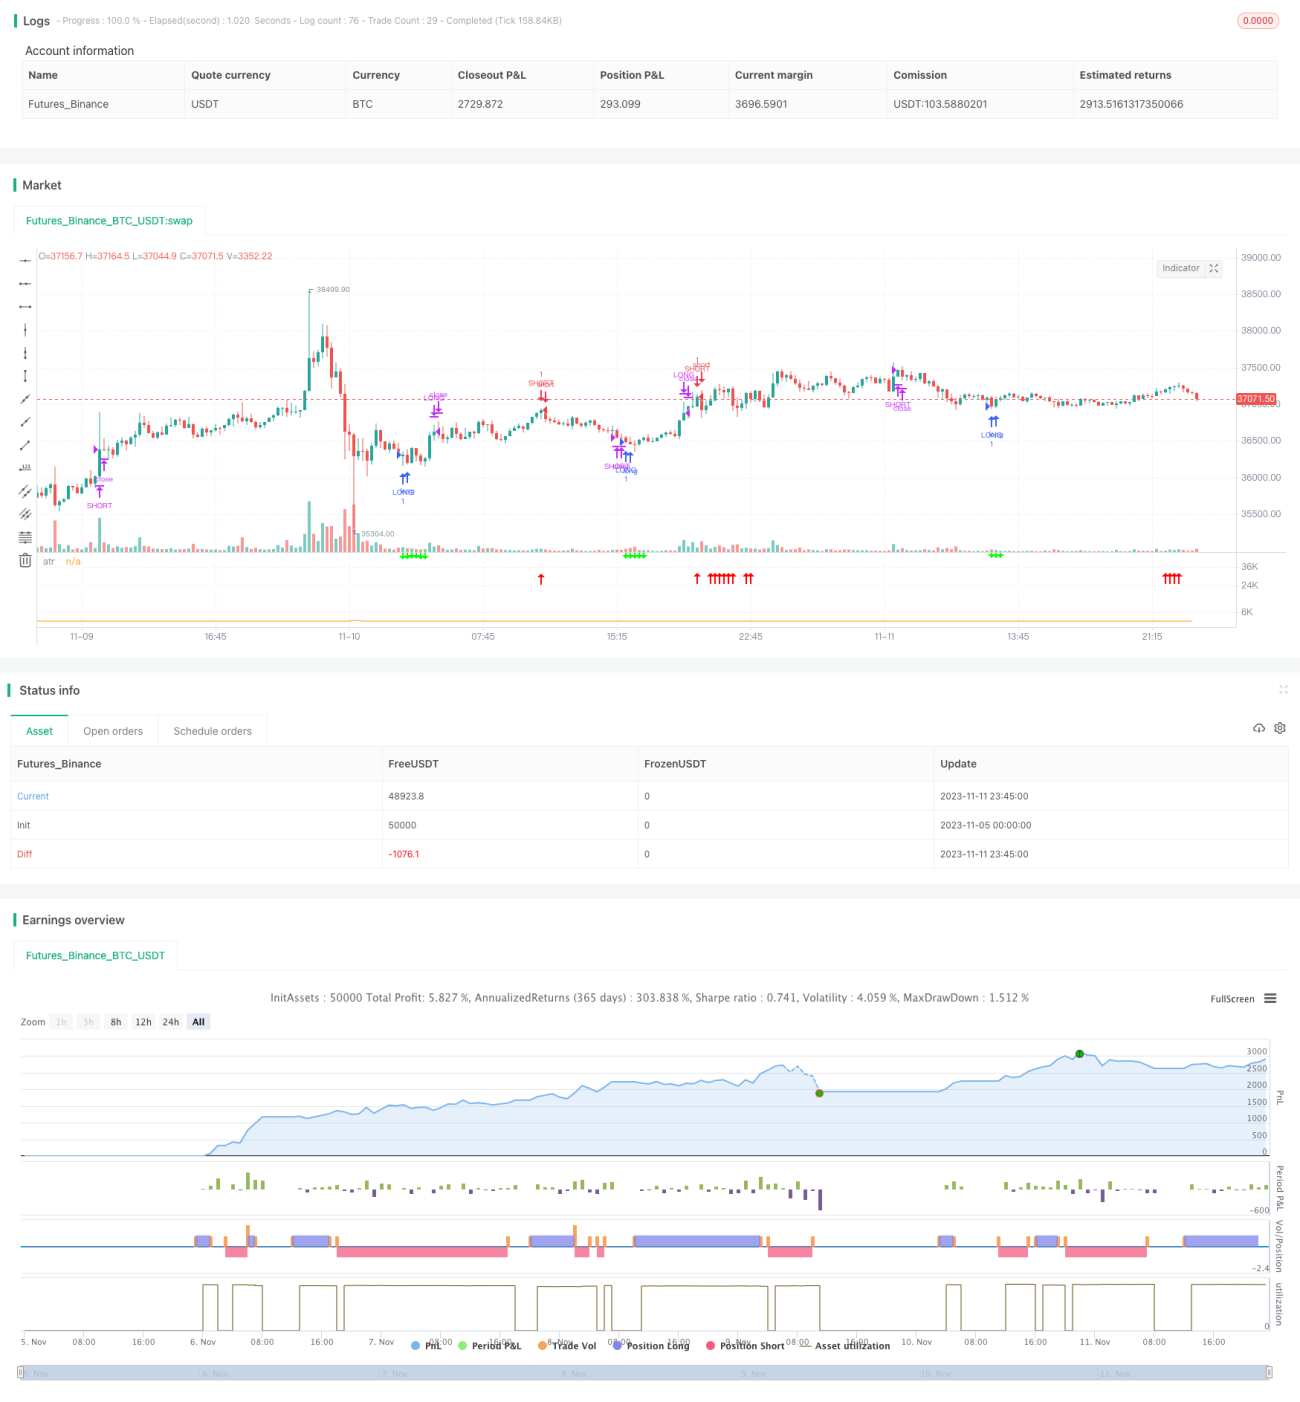
/*backtest
start: 2023-11-05 00:00:00
end: 2023-11-12 00:00:00
period: 15m
basePeriod: 5m
exchanges: [{"eid":"Futures_Binance","currency":"BTC_USDT"}]
*/
//written by [email protected]
//@version=5
strategy(title="MJ-Dual Moving Average",initial_capital=10000,overlay=false)
// import TradingView/ZigZag/6 as ZigZagLib
// // Create Zig Zag instance from user settings.
// var zigZag = ZigZagLib.newInstance(
// ZigZagLib.Settings.new(
// input.float(5.0, "Price deviation for reversals (%)", 0.00001, 100.0, 0.5, "0.00001 - 100"),
// input.int(10, "Pivot legs", 2),
// input(#2962FF, "Line color"),
// input(true, "Extend to last bar"),
// input(true, "Display reversal price"),
// input(true, "Display cumulative volume"),
// input(true, "Display reversal price change", inline = "priceRev"),
// input.string("Absolute", "", ["Absolute", "Percent"], inline = "priceRev"),
// true)
// )
// // Update 'zigZag' object on each bar with new pivots, volume, lines, labels.
// zigZag.update()
// // plot(zigZag.pivots, "zigZag")
ma1= ta.sma(close,8)
ma2= ta.sma(close,21)
angleCriteria = input.int(title="Angle", defval=7, minval=1, maxval=13)
i_lookback = input.int(2, "Angle Period", minval = 1)
i_atrPeriod = input.int(10, "ATR Period", minval = 1)
i_angleLevel = input.int(6, "Angle Level", minval = 1)
i_maSource = input.source(close, "MA Source")
TP = input.float(1, "TP", minval = 0.1)
SL = input.float(1, "SL", minval = 0.1)
f_angle(_src, _lookback, _atrPeriod) =>
rad2degree = 180 / 3.141592653589793238462643 //pi
ang = rad2degree * math.atan((_src[0] - _src[_lookback]) / ta.atr(_atrPeriod)/_lookback)
ang
_angle = f_angle(ma2, i_lookback, i_atrPeriod)
plot(ta.atr(i_atrPeriod), "atr")
// plot(ma1,color=#FF0000)
// plot(ma2,color=#00FF00)
crosso=ta.crossover(ma1,ma2)
crossu=ta.crossunder(ma1,ma2)
_lookback = 15
f_somethingHappened(_cond, _lookback) =>
bool _crossed = false
for i = 1 to _lookback
if _cond[i]
_crossed := true
_crossed
longcrossed = f_somethingHappened(crosso,_lookback)
shortcrossed = f_somethingHappened(crossu,_lookback)
atr_factor = 1
atr = ta.atr(i_atrPeriod)
e = atr * atr_factor
afr = close
afr := nz(afr[1], afr)
atr_factoryHigh = close + e
atr_factoryLow = close - e
if atr_factoryLow > afr
afr := atr_factoryLow
if atr_factoryHigh < afr
afr := atr_factoryHigh
// plot(afr, "afr", display = display.data_window)
// plot(atr_factoryHigh, "afr", color = color.yellow, display = display.all)
// plot(atr_factoryLow, "afr", color = color.green, display = display.all)
inLong() => strategy.position_size > 0
inShort() => strategy.position_size < 0
inZero() => not inLong() and not inShort()
long = longcrossed and _angle > angleCriteria
short= shortcrossed and _angle < -(angleCriteria)
plotshape(long, "Buy", shape.arrowup, location.belowbar, color = #FF0000)
plotshape(short, "Sell", shape.arrowdown, location.abovebar, color = #00FF00)
var longTp = 0.0
var longSl = 0.0
var shortTp = 0.0
var shortSl = 0.0
[b_middle, b_high, b_low] = ta.bb(close, 20, 2)
entry_price = strategy.opentrades.entry_price(0)
if inZero()
if short
longTp := close * (1 + TP/100)
longSl := close * (1 - SL/100)
strategy.entry("LONG",strategy.long, comment = "tp:" + str.tostring(longTp) + " sl:" + str.tostring(longSl))
if long
shortTp := close * (1 - TP/100)
shortSl := close * (1 + SL/100)
strategy.entry("SHORT",strategy.short, comment = "tp:" + str.tostring(shortTp) + " sl:" + str.tostring(shortSl))
if inLong()
// if close - entry_price > close * 0.005
// longSl := entry_price + close * 0.001
if high > longTp
strategy.close("LONG")
if (close - open) > close * 0.014
shortTp := close * (1 - TP/100)
shortSl := close * (1 + SL/100)
strategy.entry("SHORT",strategy.short, comment = "tp:" + str.tostring(shortTp) + " sl:" + str.tostring(shortSl))
if close < longSl
strategy.close("LONG")
if open >= b_high and close >= b_high
strategy.close("LONG")
// if high > b_high and entry_price < high
// strategy.close("LONG")
if inShort()
// if entry_price - close > close * 0.005
// shortSl := entry_price - close * 0.001
if low < shortTp
strategy.close("SHORT")
if (open - close) > close * 0.014
longTp := close * (1 + TP/100)
longSl := close * (1 - SL/100)
strategy.entry("LONG",strategy.long, comment = "tp:" + str.tostring(longTp) + " sl:" + str.tostring(longSl))
if close > shortSl
strategy.close("SHORT")
if open < b_low and close < b_low
strategy.close("SHORT")
// if low < b_low and entry_price > low
// strategy.close("SHORT")