SMA Based Dual Thrust Strategy

Overview
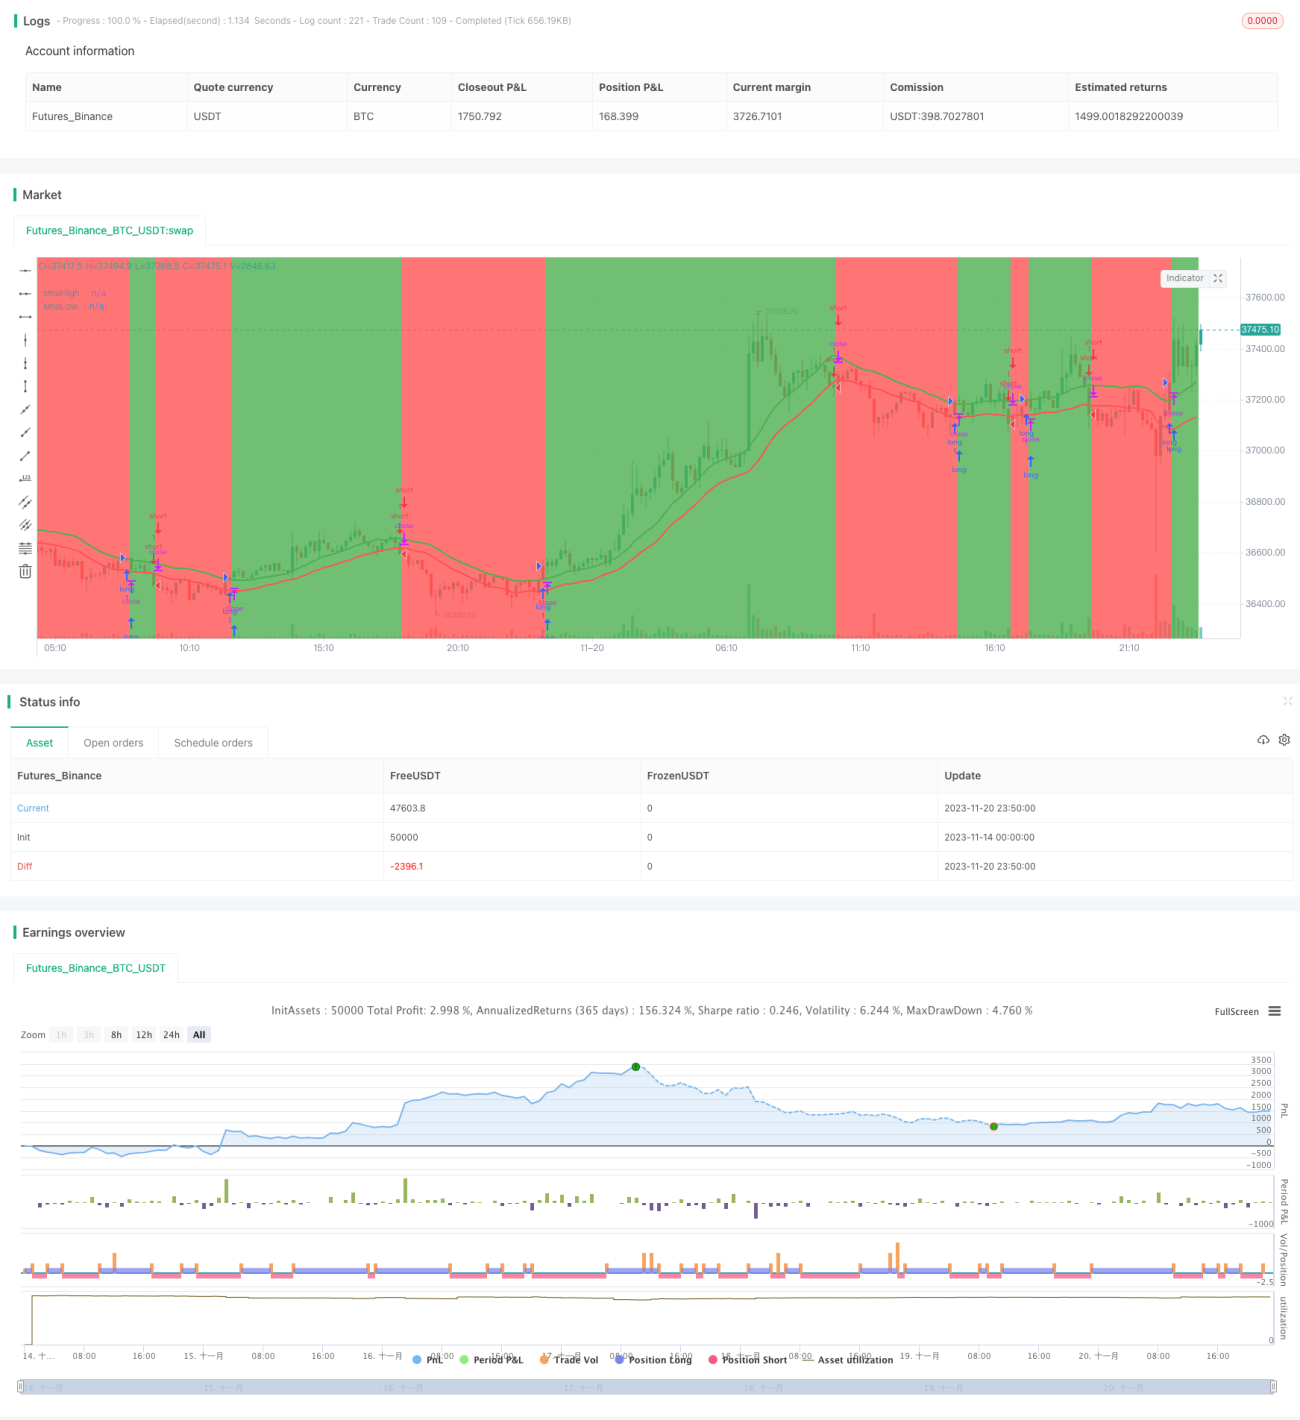
This strategy builds a simple dual thrust strategy based on the SMA indicator. It goes long when the price crosses above the 20-period highest SMA and goes short when the price crosses below the 20-period lowest SMA. Stop loss exits are also set.
Strategy Logic
This strategy uses the 20-period SMA of highest high price and lowest low price to determine the direction for trading. When price crosses above the highest SMA, it is considered as an uptrend, so go long. When price crosses below the lowest SMA, it is considered as a downtrend, so go short.
Specifically, the strategy first calculates the 20-period SMA of highest high and lowest low prices, and plots the indicator lines. The following trading logic is then set:
Long entry: Close price crosses above highest SMA
Long exit: Close price crosses below 0.99 * highest SMA
Short entry: Close price crosses below lowest SMA
Short exit: Close price crosses above 1.01 * lowest SMA
So an trend following dual thrust strategy is built.
Advantage Analysis
This strategy has the following advantages:
- Using SMA to determine trend direction is simple and practical
- Highest SMA and Lowest SMA act as support/resistance lines
- Reasonable stop loss design to maximize protection from huge losses
- Good adaptability, can be used on different products and timeframes
Risk Analysis
There are also some risks with this strategy:
- SMA has lagging effect, may miss trend turning points
- No protection from market sudden events
- Trading cost impact not considered
These risks can be controlled and reduced in ways like combining other indicators, setting stop loss, parameter tuning etc.
Improvement Directions
This strategy can also be improved in the following aspects:
- Combine other indicators like MACD, KDJ to determine trend
- Add protection for sudden events like suspension, price limiting etc
- Optimize SMA periods, find the best parameter combination
- Find best parameters for different products and timeframes
- Estimate trading cost impact, set optimal stop loss and take profit
Conclusion
The overall logic of this strategy is clear and easy to implement. By using SMA to determine trend direction, and setting reasonable entry/exit rules, good results can be achieved. There is room for further optimization, and by combining with other techniques, it can become a promising strategy worth long term tracking.
- 1