
The Bollinger Bands Breakout Strategy is a short-term trend following strategy optimized for crypto trading. It utilizes the well-established Bollinger Bands indicator as the core signal generator and is capable of taking both long and short positions. With comprehensive risk management mechanisms, it is a robust automated trading system suitable for trending markets.
The strategy features a high level of configurability, including the Bollinger Bands parameters, various filters, take profit/stop loss settings and maximum intraday loss threshold. This adaptability empowers the strategy to achieve reliable performance across various market regimes.
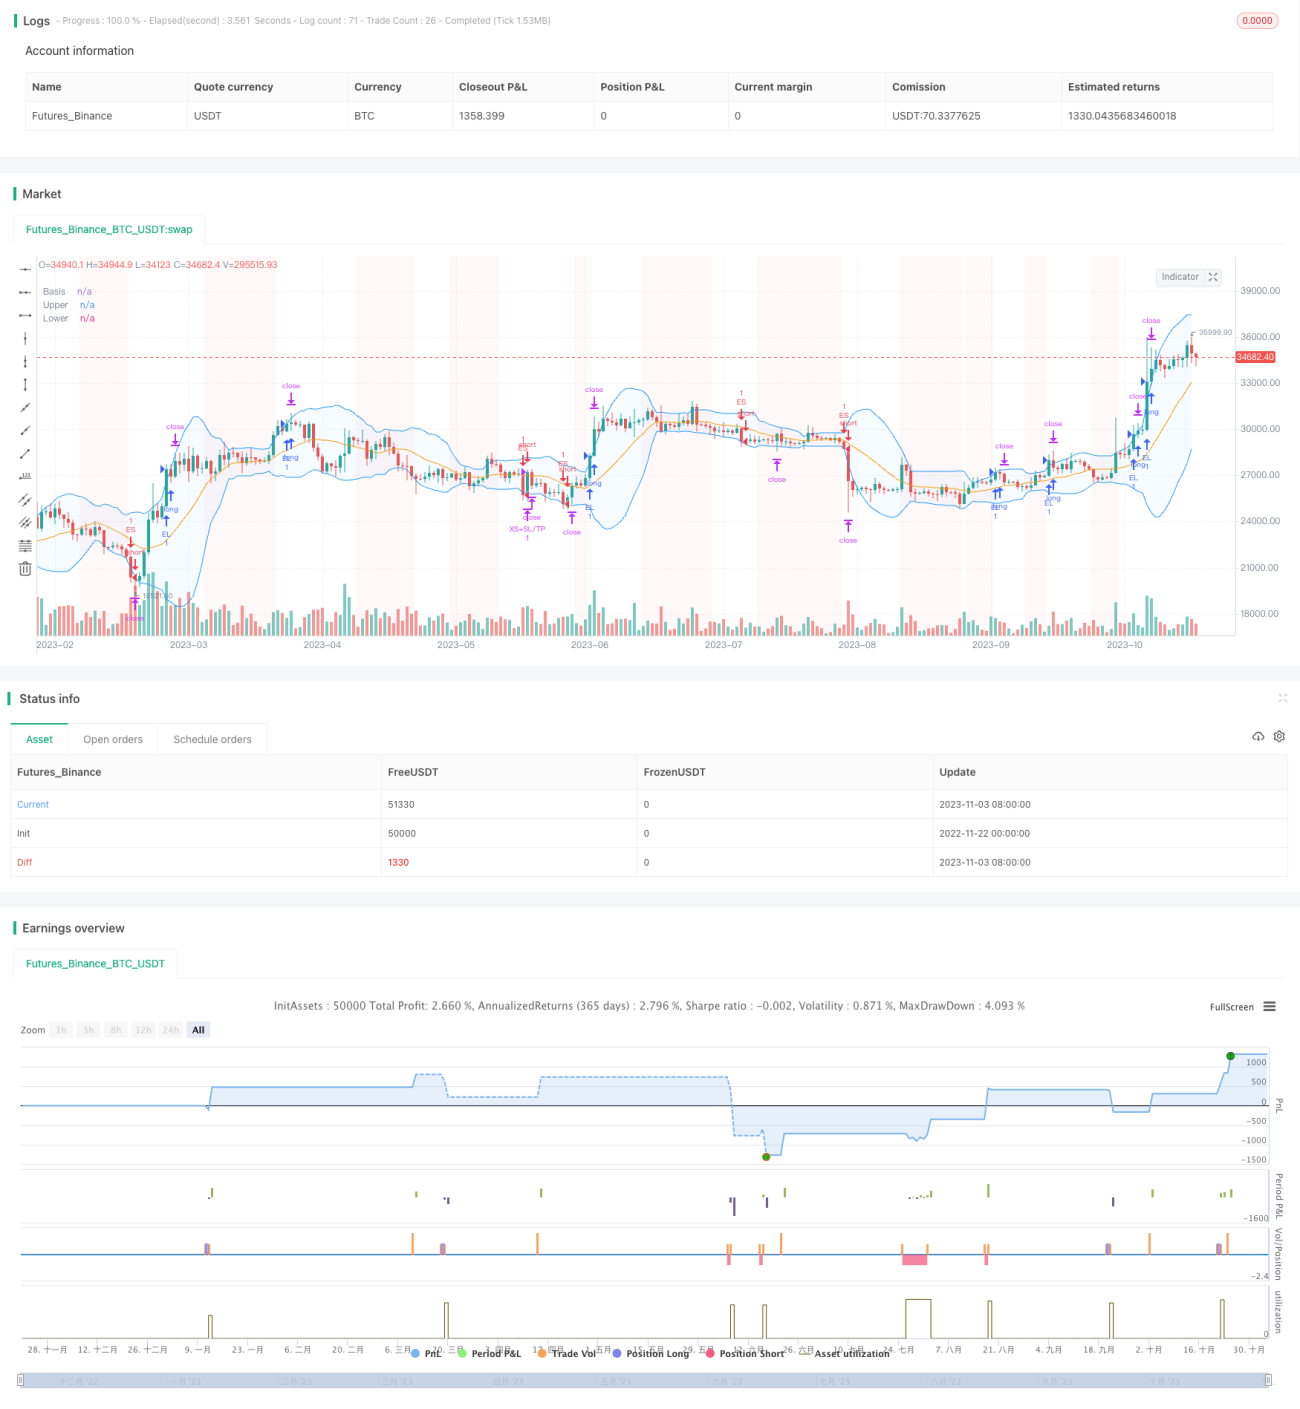
The strategy centres around the Bollinger Bands indicator, which calculates a middle band, an upper band and a lower band that serve as proxies for price averages and volatility limits. The crossing of price over the upper or lower bands generates entry signals – long when price breaks above upper band, short when below lower band.
In addition, multiple filters are implemented to avoid false signals:
Trend Filter: long above moving average, short below moving average
Volatility Filter: only trade when volatility expands
Direction Filter: configurable for long-only, short-only or both directions
Rate of Change Filter: sufficient price movement from previous close required
Date Filter: for backtesting timeframe specification
Exits are handled through take profit, stop loss and trailing stop mechanisms to lock in gains and limit losses. Maximum intraday loss threshold provides another layer of daily drawdown protection.
The main advantages of this strategy include:
Reliable Bollinger Bands indicator as core signal
Customizable filters prevent unwanted trades
Comprehensive stop loss/take profit design
Max intraday loss guards against extreme drawdown
Thrives in trending markets with profit potential
Despite the advantages, some risks remain:
Whipsaws around Bollinger Bands may lead to losses
Too rigid filters reduce trades in range-bound markets
Gaps can stop out positions preemptively
Extreme moves cannot be fully avoided
Mitigations include adjusting filters, manual intervention and tweaked stops.
Possible optimizations for this strategy:
Search for optimal parameter combinations
Introduce machine learning for adaptive optimization
Research better stop loss methods e.g. volatility stops
Incorporate sentiment to guide discretionary actions
Utilize correlated instruments for statistical arbitrage
The Bollinger Bands Breakout Strategy is a time-tested system for short-term trend trading. By combining the merits of Bollinger Bands signal and prudent filters, it generates quality entries for trends while avoiding false signals. Comprehensive risk management mechanisms also contain drawdowns effectively. With continuous improvements, this strategy has the potential to become a formidable automated trading system.
/*backtest
start: 2022-11-22 00:00:00
end: 2023-11-04 05:20:00
period: 1d
basePeriod: 1h
exchanges: [{"eid":"Futures_Binance","currency":"BTC_USDT"}]
*/
//@version=5
strategy("Bollinger Bands - Breakout Strategy",overlay=true
)
// Define the length of the Bollinger Bands
bbLengthInput = input.int (15,title="Length", group="Bollinger Bands", inline="BB")
bbDevInput = input.float (2.0,title="StdDev", group="Bollinger Bands", inline="BB")
// Define the settings for the Trend Filter
trendFilterInput = input.bool(false, title="Above/Below", group = "Trend Filter", inline="Trend")
trendFilterPeriodInput = input(223,title="", group = "Trend Filter", inline="Trend")
trendFilterType = input.string (title="", defval="EMA",options=["EMA","SMA","RMA", "WMA"], group = "Trend Filter", inline="Trend")
volatilityFilterInput = input.bool(true,title="StdDev", group = "Volatility Filter", inline="Vol")
volatilityFilterStDevLength = input(15,title="",group = "Volatility Filter", inline="Vol")
volatilityStDevMaLength = input(15,title=">MA",group = "Volatility Filter", inline="Vol")
// ROC Filter
// f_security function by LucF for PineCoders available here: https://www.tradingview.com/script/cyPWY96u-How-to-avoid-repainting-when-using-security-PineCoders-FAQ/
f_security(_sym, _res, _src, _rep) => request.security(_sym, _res, _src[not _rep and barstate.isrealtime ? 1 : 0])[_rep or barstate.isrealtime ? 0 : 1]
high_daily = f_security(syminfo.tickerid, "D", high, false)
roc_enable = input.bool(false, "", group="ROC Filter from CloseD", inline="roc")
roc_threshold = input.float(1, "Treshold", step=0.5, group="ROC Filter from CloseD", inline="roc")
closed = f_security(syminfo.tickerid,"1D",close, false)
roc_filter= roc_enable ? (close-closed)/closed*100 > roc_threshold : true
// Trade Direction Filter
// tradeDirectionInput = input.string("Auto",options=["Auto", "Long&Short","Long Only", "Short Only"], title="Trade", group="Direction Filter", tooltip="Auto: if a PERP is detected (in the symbol description), trade long and short\n Otherwise as per user-input")
// tradeDirection = switch tradeDirectionInput
// "Auto" => str.contains(str.lower(syminfo.description), "perp") or str.contains(str.lower(syminfo.description), ".p") ? strategy.direction.all : strategy.direction.long
// "Long&Short" => strategy.direction.all
// "Long Only" => strategy.direction.long
// "Short Only" => strategy.direction.short
// => strategy.direction.all
// strategy.risk.allow_entry_in(tradeDirection)
// Calculate and plot the Bollinger Bands
[bbMiddle, bbUpper, bbLower] = ta.bb (close, bbLengthInput, bbDevInput)
plot(bbMiddle, "Basis", color=color.orange)
bbUpperPlot = plot(bbUpper, "Upper", color=color.blue)
bbLowerrPlot = plot(bbLower, "Lower", color=color.blue)
fill(bbUpperPlot, bbLowerrPlot, title = "Background", color=color.new(color.blue, 95))
// Calculate and view Trend Filter
float tradeConditionMa = switch trendFilterType
"EMA" => ta.ema(close, trendFilterPeriodInput)
"SMA" => ta.sma(close, trendFilterPeriodInput)
"RMA" => ta.rma(close, trendFilterPeriodInput)
"WMA" => ta.wma(close, trendFilterPeriodInput)
// Default used when the three first cases do not match.
=> ta.wma(close, trendFilterPeriodInput)
trendConditionLong = trendFilterInput ? close > tradeConditionMa : true
trendConditionShort = trendFilterInput ? close < tradeConditionMa : true
plot(trendFilterInput ? tradeConditionMa : na, color=color.yellow)
// Calculate and view Volatility Filter
stdDevClose = ta.stdev(close,volatilityFilterStDevLength)
volatilityCondition = volatilityFilterInput ? stdDevClose > ta.sma(stdDevClose,volatilityStDevMaLength) : true
bbLowerCrossUnder = ta.crossunder(close, bbLower)
bbUpperCrossOver = ta.crossover(close, bbUpper)
bgcolor(volatilityCondition ? na : color.new(color.red, 95))
// Date Filter
start = input(timestamp("2017-01-01"), "Start", group="Date Filter")
finish = input(timestamp("2050-01-01"), "End", group="Date Filter")
date_filter = true
// Entry and Exit Conditions
entryLongCondition = bbUpperCrossOver and trendConditionLong and volatilityCondition and date_filter and roc_filter
entryShortCondition = bbLowerCrossUnder and trendConditionShort and volatilityCondition and date_filter and roc_filter
exitLongCondition = bbLowerCrossUnder
exitShortCondition = bbUpperCrossOver
// Orders
if entryLongCondition
strategy.entry("EL", strategy.long)
if entryShortCondition
strategy.entry("ES", strategy.short)
if exitLongCondition
strategy.close("EL")
if exitShortCondition
strategy.close("ES")
// Long SL/TP/TS
xl_ts_percent = input.float(2,step=0.5, title= "TS", group="Exit Long", inline="LTS", tooltip="Trailing Treshold %")
xl_to_percent = input.float(0.5, step=0.5, title= "TO", group="Exit Long", inline="LTS", tooltip="Trailing Offset %")
xl_ts_tick = xl_ts_percent * close/syminfo.mintick/100
xl_to_tick = xl_to_percent * close/syminfo.mintick/100
xl_sl_percent = input.float (2, step=0.5, title="SL",group="Exit Long", inline="LSLTP")
xl_tp_percent = input.float(9, step=0.5, title="TP",group="Exit Long", inline="LSLTP")
xl_sl_price = strategy.position_avg_price * (1-xl_sl_percent/100)
xl_tp_price = strategy.position_avg_price * (1+xl_tp_percent/100)
strategy.exit("XL+SL/TP", "EL", stop=xl_sl_price, limit=xl_tp_price, trail_points=xl_ts_tick, trail_offset=xl_to_tick,comment_loss= "XL-SL", comment_profit = "XL-TP",comment_trailing = "XL-TS")
// Short SL/TP/TS
xs_ts_percent = input.float(2,step=0.5, title= "TS",group="Exit Short", inline ="STS", tooltip="Trailing Treshold %")
xs_to_percent = input.float(0.5, step=0.5, title= "TO",group="Exit Short", inline ="STS", tooltip="Trailing Offset %")
xs_ts_tick = xs_ts_percent * close/syminfo.mintick/100
xs_to_tick = xs_to_percent * close/syminfo.mintick/100
xs_sl_percent = input.float (2, step=0.5, title="SL",group="Exit Short", inline="ESSLTP", tooltip="Stop Loss %")
xs_tp_percent = input.float(9, step=0.5, title="TP",group="Exit Short", inline="ESSLTP", tooltip="Take Profit %")
xs_sl_price = strategy.position_avg_price * (1+xs_sl_percent/100)
xs_tp_price = strategy.position_avg_price * (1-xs_tp_percent/100)
strategy.exit("XS+SL/TP", "ES", stop=xs_sl_price, limit=xs_tp_price, trail_points=xs_ts_tick, trail_offset=xs_to_tick,comment_loss= "XS-SL", comment_profit = "XS-TP",comment_trailing = "XS-TS")
max_intraday_loss = input.int(10, title="Max Intraday Loss (Percent)", group="Risk Management")
//strategy.risk.max_intraday_loss(max_intraday_loss, strategy.percent_of_equity)
// Monthly Returns table, modified from QuantNomad. Please put calc_on_every_tick = true to plot it.
monthly_table(int results_prec, bool results_dark) =>
new_month = month(time) != month(time[1])
new_year = year(time) != year(time[1])
eq = strategy.equity
bar_pnl = eq / eq[1] - 1
cur_month_pnl = 0.0
cur_year_pnl = 0.0
// Current Monthly P&L
cur_month_pnl := new_month ? 0.0 :
(1 + cur_month_pnl[1]) * (1 + bar_pnl) - 1
// Current Yearly P&L
cur_year_pnl := new_year ? 0.0 :
(1 + cur_year_pnl[1]) * (1 + bar_pnl) - 1
// Arrays to store Yearly and Monthly P&Ls
var month_pnl = array.new_float(0)
var month_time = array.new_int(0)
var year_pnl = array.new_float(0)
var year_time = array.new_int(0)
last_computed = false
if (not na(cur_month_pnl[1]) and (new_month or barstate.islast))
if (last_computed[1])
array.pop(month_pnl)
array.pop(month_time)
array.push(month_pnl , cur_month_pnl[1])
array.push(month_time, time[1])
if (not na(cur_year_pnl[1]) and (new_year or barstate.islast))
if (last_computed[1])
array.pop(year_pnl)
array.pop(year_time)
array.push(year_pnl , cur_year_pnl[1])
array.push(year_time, time[1])
last_computed := barstate.islast ? true : nz(last_computed[1])
// Monthly P&L Table
var monthly_table = table(na)
cell_hr_bg_color = results_dark ? #0F0F0F : #F5F5F5
cell_hr_text_color = results_dark ? #D3D3D3 : #555555
cell_border_color = results_dark ? #000000 : #FFFFFF
// ell_hr_bg_color = results_dark ? #0F0F0F : #F5F5F5
// cell_hr_text_color = results_dark ? #D3D3D3 : #555555
// cell_border_color = results_dark ? #000000 : #FFFFFF
if (barstate.islast)
monthly_table := table.new(position.bottom_right, columns = 14, rows = array.size(year_pnl) + 1, bgcolor=cell_hr_bg_color,border_width=1,border_color=cell_border_color)
table.cell(monthly_table, 0, 0, syminfo.tickerid + " " + timeframe.period, text_color=cell_hr_text_color, bgcolor=cell_hr_bg_color)
table.cell(monthly_table, 1, 0, "Jan", text_color=cell_hr_text_color, bgcolor=cell_hr_bg_color)
table.cell(monthly_table, 2, 0, "Feb", text_color=cell_hr_text_color, bgcolor=cell_hr_bg_color)
table.cell(monthly_table, 3, 0, "Mar", text_color=cell_hr_text_color, bgcolor=cell_hr_bg_color)
table.cell(monthly_table, 4, 0, "Apr", text_color=cell_hr_text_color, bgcolor=cell_hr_bg_color)
table.cell(monthly_table, 5, 0, "May", text_color=cell_hr_text_color, bgcolor=cell_hr_bg_color)
table.cell(monthly_table, 6, 0, "Jun", text_color=cell_hr_text_color, bgcolor=cell_hr_bg_color)
table.cell(monthly_table, 7, 0, "Jul", text_color=cell_hr_text_color, bgcolor=cell_hr_bg_color)
table.cell(monthly_table, 8, 0, "Aug", text_color=cell_hr_text_color, bgcolor=cell_hr_bg_color)
table.cell(monthly_table, 9, 0, "Sep", text_color=cell_hr_text_color, bgcolor=cell_hr_bg_color)
table.cell(monthly_table, 10, 0, "Oct", text_color=cell_hr_text_color, bgcolor=cell_hr_bg_color)
table.cell(monthly_table, 11, 0, "Nov", text_color=cell_hr_text_color, bgcolor=cell_hr_bg_color)
table.cell(monthly_table, 12, 0, "Dec", text_color=cell_hr_text_color, bgcolor=cell_hr_bg_color)
table.cell(monthly_table, 13, 0, "Year", text_color=cell_hr_text_color, bgcolor=cell_hr_bg_color)
for yi = 0 to array.size(year_pnl) - 1
table.cell(monthly_table, 0, yi + 1, str.tostring(year(array.get(year_time, yi))), text_color=cell_hr_text_color, bgcolor=cell_hr_bg_color)
y_color = array.get(year_pnl, yi) > 0 ? color.lime : array.get(year_pnl, yi) < 0 ? color.red : color.gray
table.cell(monthly_table, 13, yi + 1, str.tostring(math.round(array.get(year_pnl, yi) * 100, results_prec)), bgcolor = y_color)
for mi = 0 to array.size(month_time) - 1
m_row = year(array.get(month_time, mi)) - year(array.get(year_time, 0)) + 1
m_col = month(array.get(month_time, mi))
m_color = array.get(month_pnl, mi) > 0 ? color.lime : array.get(month_pnl, mi) < 0 ? color.red : color.gray
table.cell(monthly_table, m_col, m_row, str.tostring(math.round(array.get(month_pnl, mi) * 100, results_prec)), bgcolor = m_color)
results_prec = input(2, title = "Precision", group="Results Table")
results_dark = input.bool(defval=true, title="Dark Mode", group="Results Table")
monthly_table(results_prec, results_dark)