Overview
The Balancing Trend strategy is a trend following strategy that utilizes the Ichimoku Kinko Hyo indicator. It identifies trend directions by combining multiple indicators, goes long in a bull market and goes short in a bear market, to achieve long-term capital appreciation.
Strategy Principle
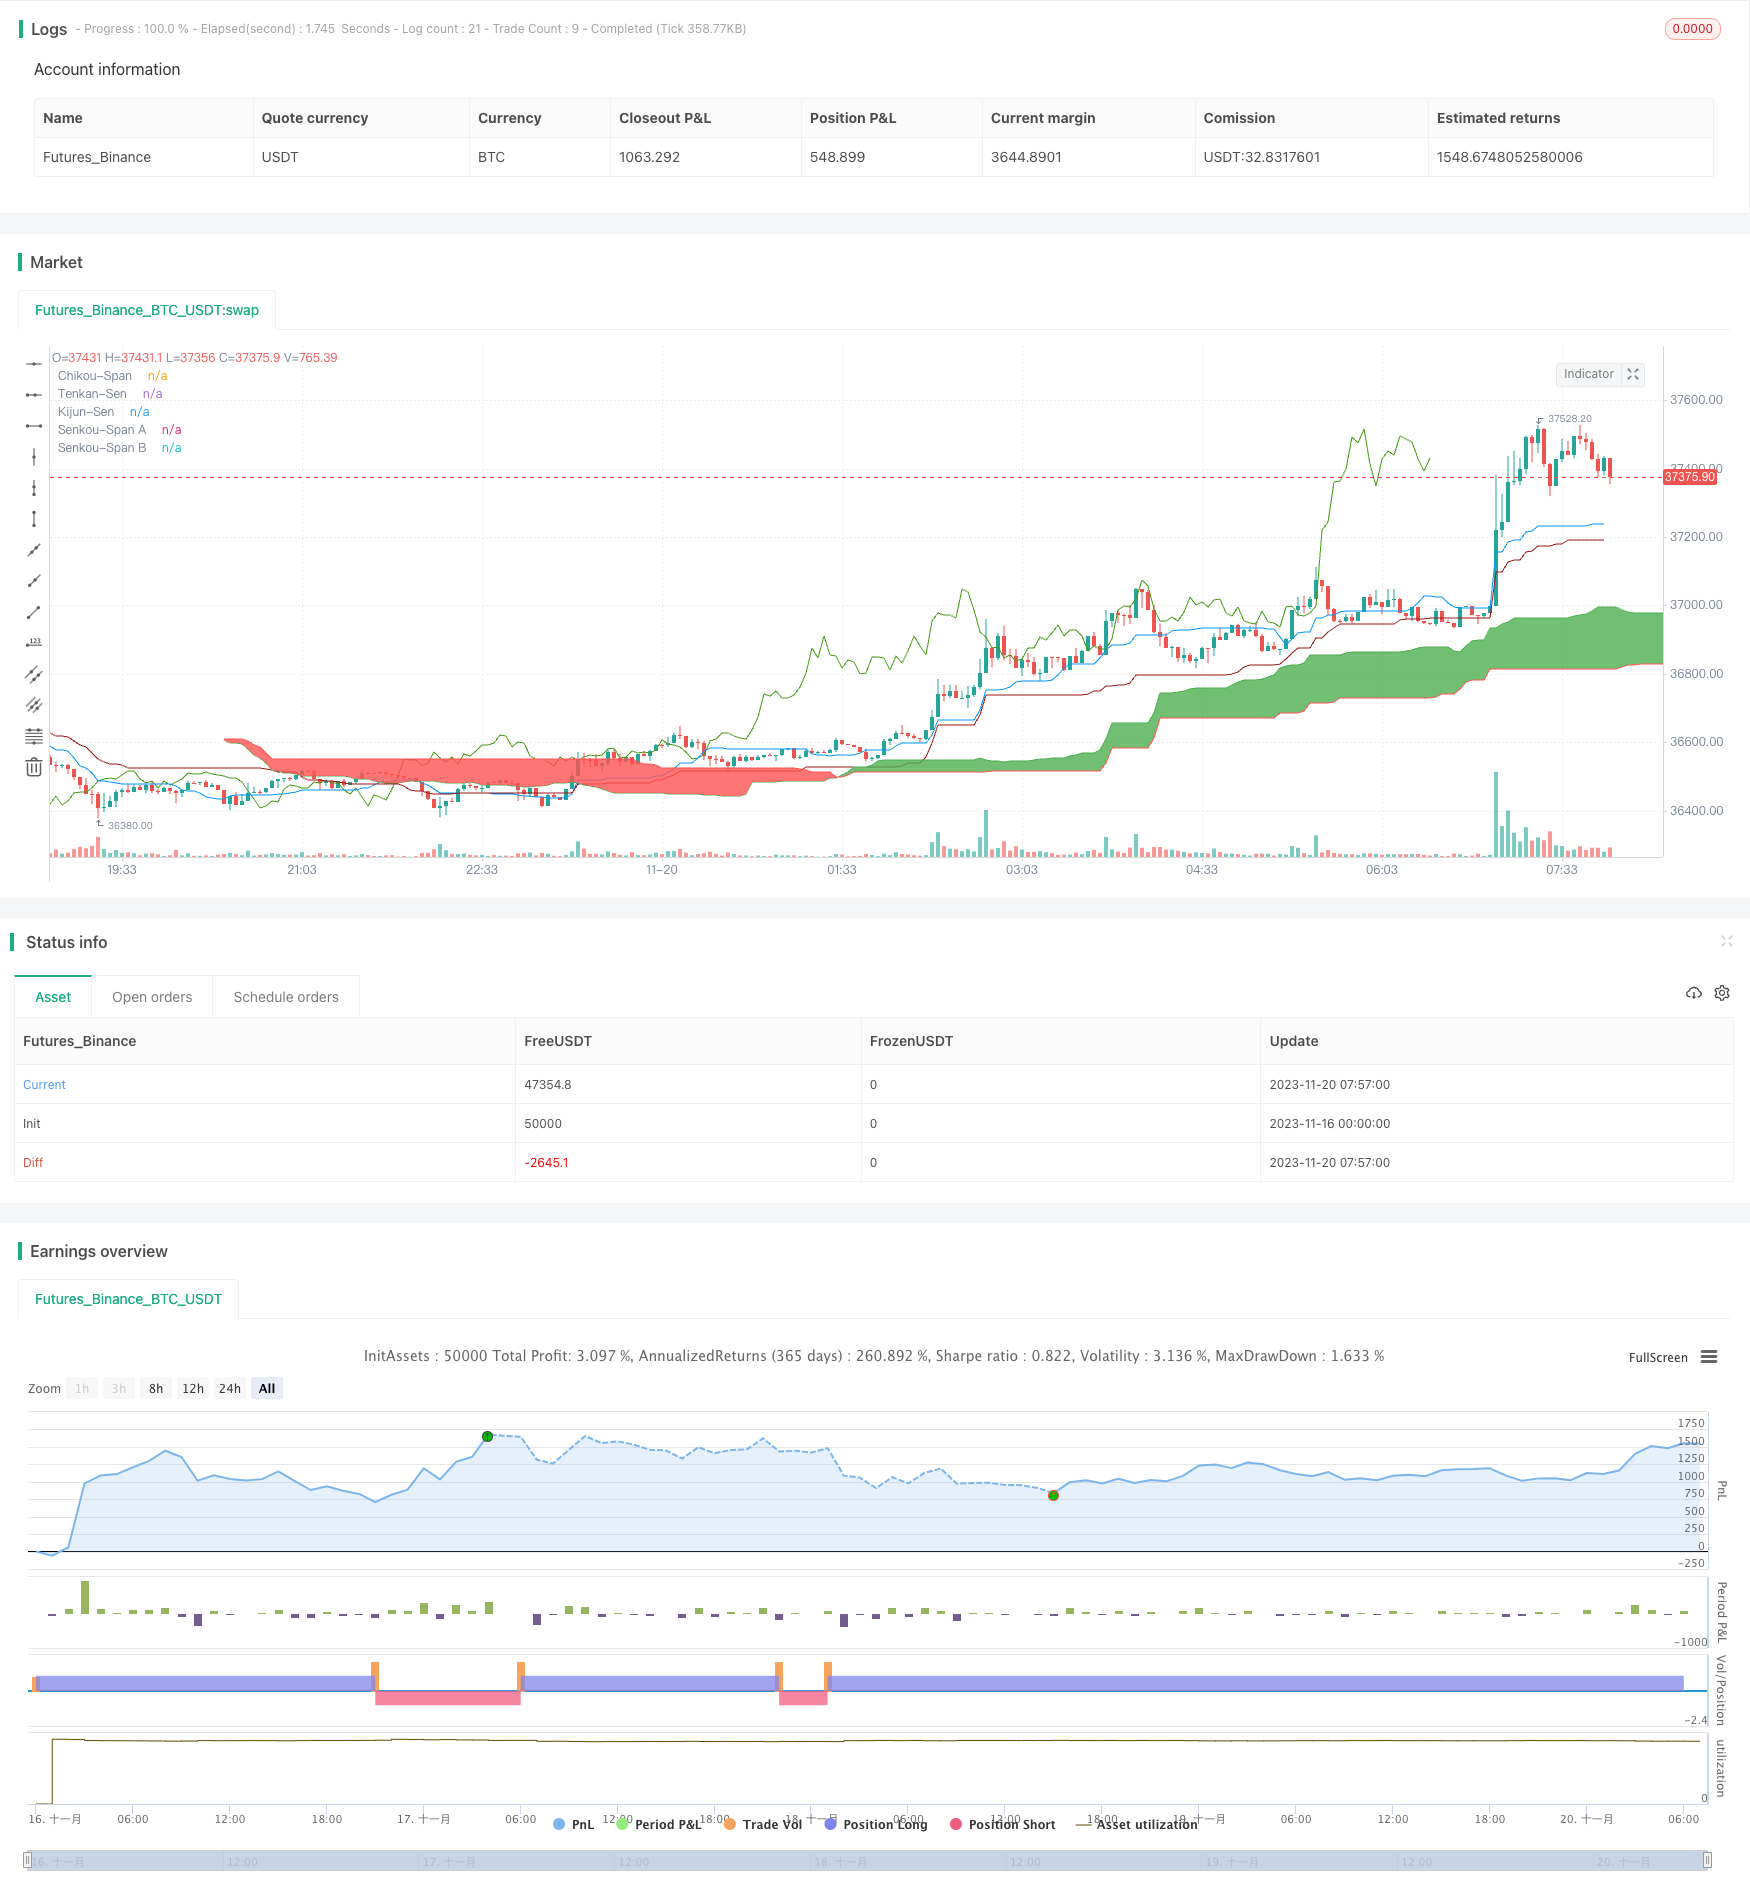
The core of this strategy is based on the Ichimoku Kinko Hyo indicator, which consists of the Tenkan-Sen (Conversion Line), Kijun-Sen (Base Line), Senkou Span A (Leading Span A), Senkou Span B (Leading Span B) and Chikou Span (Lagging Span). When price is above the cloud, it signals an upward trend. When price is below the cloud, it signals a downward trend.
The trading signals are generated based on the combination of the following conditions:
- Tenkan-Sen crosses above Kijun-Sen as bullish signal
- Tenkan-Sen crosses below Kijun-Sen as bearish signal
- Chikou Span crossover upward as bullish confirmation
- Chikou Span crossover downward as bearish confirmation
- RSI above 50 as bullish indicator
- RSI below 50 as bearish indicator
- Price above the cloud indicates upward trend
- Price below the cloud indicates downward trend
It goes long when all bullish conditions are met and goes short when all bearish conditions are met.
Advantage Analysis
This strategy combines trend following and overbought-oversold indicators to effectively identify trend directions. The main advantages are:
- Ichimoku Kinko Hyo can identify medium- to long-term trends, avoiding being misled by short-term market noises.
- Incorporating RSI helps determine overbought and oversold zones, preventing missing reversal opportunities.
- Only acts when volatility is high enough, avoiding ineffective trades.
- Strict entry and exit rules maximally mitigate risks.
Risk Analysis
Some risks to note for this strategy:
- Ichimoku Kinko Hyo has lagging effect, possibly delaying entry timing.
- Low frequency of trade signal occurrence with multiple condition combination, leading to insufficient number of trades.
- No consideration around position sizing and risk management, risks around over-trading.
Corresponding solutions:
- Shorten Ichimoku parameters to improve sensitivity.
- Reduce strictness of entry conditions to increase trade frequency.
- Incorporate risk management and position sizing modules to control per trade risk exposure and overall position.
Optimization Directions
The strategy can be improved in the following aspects:
- Add or combine additional indicators like KDJ, MACD to diversify signal sources.
- Optimize Ichimoku parameters to improve sensitivity.
- Add stop loss mechanisms to lock in profits and control risks.
- Incorporate dynamic position sizing module based on account size.
- Add hedging module to manage risks for long positions.
Summary
Overall this Balancing Trend strategy is a reliable, robust trend following system. It addresses the key challenge in trend trading - balancing trend identification accuracy and trade generation frequency. There is still room for improvement through parameter tuning and module expansion. It is a strategy that can be applied for the long run.
/*backtest
start: 2023-11-16 00:00:00
end: 2023-11-20 08:00:00
period: 3m
basePeriod: 1m
exchanges: [{"eid":"Futures_Binance","currency":"BTC_USDT"}]
*/

//@version=4
strategy("Ichimoku Kinko Hyo: ETH 3h Strategy by tobuno", overlay=true)

//Inputs
ts_bars = input(22, minval=1, title="Tenkan-Sen Bars")
ks_bars = input(60, minval=1, title="Kijun-Sen Bars")
ssb_bars = input(120, minval=1, title="Senkou-Span B Bars")
cs_offset = input(30, minval=1, title="Chikou-Span Offset")
ss_offset = input(30, minval=1, title="Senkou-Span Offset")
long_entry = input(true, title="Long Entry")
short_entry = input(true, title="Short Entry")

//Volatility
vollength = input(defval=2, title="VolLength")
voltarget = input(defval=0.2, type=float, step=0.1, title="Volatility Target")
Difference = abs((close - open)/((close + open)/2) * 100)
MovingAverage = sma(Difference, vollength)
highvolatility = MovingAverage > voltarget

////////////////////////////////////////////////////////////////////////////////
// BACKTESTING RANGE

// From Date Inputs
fromDay = input(defval = 1, title = "From Day", minval = 1, maxval = 31)
fromMonth = input(defval = 1, title = "From Month", minval = 1, maxval = 12)
fromYear = input(defval = 2019, title = "From Year", minval = 1970)

// To Date Inputs
toDay = input(defval = 31, title = "To Day", minval = 1, maxval = 31)
toMonth = input(defval = 12, title = "To Month", minval = 1, maxval = 12)
toYear = input(defval = 2020, title = "To Year", minval = 1970)

// Calculate start/end date and time condition
startDate = timestamp(fromYear, fromMonth, fromDay, 00, 00)
finishDate = timestamp(toYear, toMonth, toDay, 00, 00)
time_cond = true

////////////////////////////////////////////////////////////////////////////////

middle(len) => avg(lowest(len), highest(len))

// Ichimoku Components
tenkan = middle(ts_bars)
kijun = middle(ks_bars)
senkouA = avg(tenkan, kijun)
senkouB = middle(ssb_bars)

//RSI
change = change(close)
gain = change >= 0 ? change : 0.0
loss = change < 0 ? (-1) * change : 0.0
avgGain = rma(gain, 14)
avgLoss = rma(loss, 14)
rs = avgGain / avgLoss
rsi = 100 - (100 / (1 + rs))

// Plot Ichimoku Kinko Hyo
plot(tenkan, color=#0496ff, title="Tenkan-Sen")
plot(kijun, color=#991515, title="Kijun-Sen")
plot(close, offset=-cs_offset+1, color=#459915, title="Chikou-Span")
sa=plot(senkouA, offset=ss_offset-1, color=green, title="Senkou-Span A")
sb=plot(senkouB, offset=ss_offset-1, color=red, title="Senkou-Span B")
fill(sa, sb, color = senkouA > senkouB ? green : red, title="Cloud color")

ss_high = max(senkouA[ss_offset-1], senkouB[ss_offset-1])
ss_low = min(senkouA[ss_offset-1], senkouB[ss_offset-1])

// Entry/Exit Signals
tk_cross_bull = tenkan > kijun
tk_cross_bear = tenkan < kijun
cs_cross_bull = mom(close, cs_offset-1) > 0
cs_cross_bear = mom(close, cs_offset-1) < 0
price_above_kumo = close > ss_high
price_below_kumo = close < ss_low
rsi_bullish = rsi > 50
rsi_bearish = rs < 50
bullish = tk_cross_bull and cs_cross_bull and price_above_kumo and rsi_bullish and highvolatility
bearish = tk_cross_bear and cs_cross_bear and price_below_kumo and rsi_bearish and highvolatility

strategy.entry("Long", strategy.long, when=bullish and long_entry and time_cond)
strategy.entry("Short", strategy.short, when=bearish and short_entry and time_cond)

strategy.close("Long", when=bearish and not short_entry and time_cond)
strategy.close("Short", when=bullish and not long_entry and time_cond)