
The Reversal-Catcher strategy is a reversal trading strategy that utilizes volatility indicator Bollinger Bands and momentum indicator RSI. It sets the Bollinger Bands channel and RSI overbought/oversold lines as signals to find reversal opportunities when trend direction changes.
The strategy uses Bollinger Bands as the main technical indicator, combined with RSI and other momentum indicators to verify trading signals. The specific logic is:
The advantages of this strategy includes:
The risks of this strategy includes:
To control the risks, we can set stop loss level to limit risk exposure, and optimize parameters like Bollinger Bands period or RSI figures to improve system performance.
The main optimization directions includes:
The Reversal-Catcher strategy is an effective short-term trading strategy overall. By combining trend filtering and reversal signals, it can avoid false signals during market consolidation and avoid fighting against trend. Through continuous parameters and model optimization, better strategy performance can be achieved.
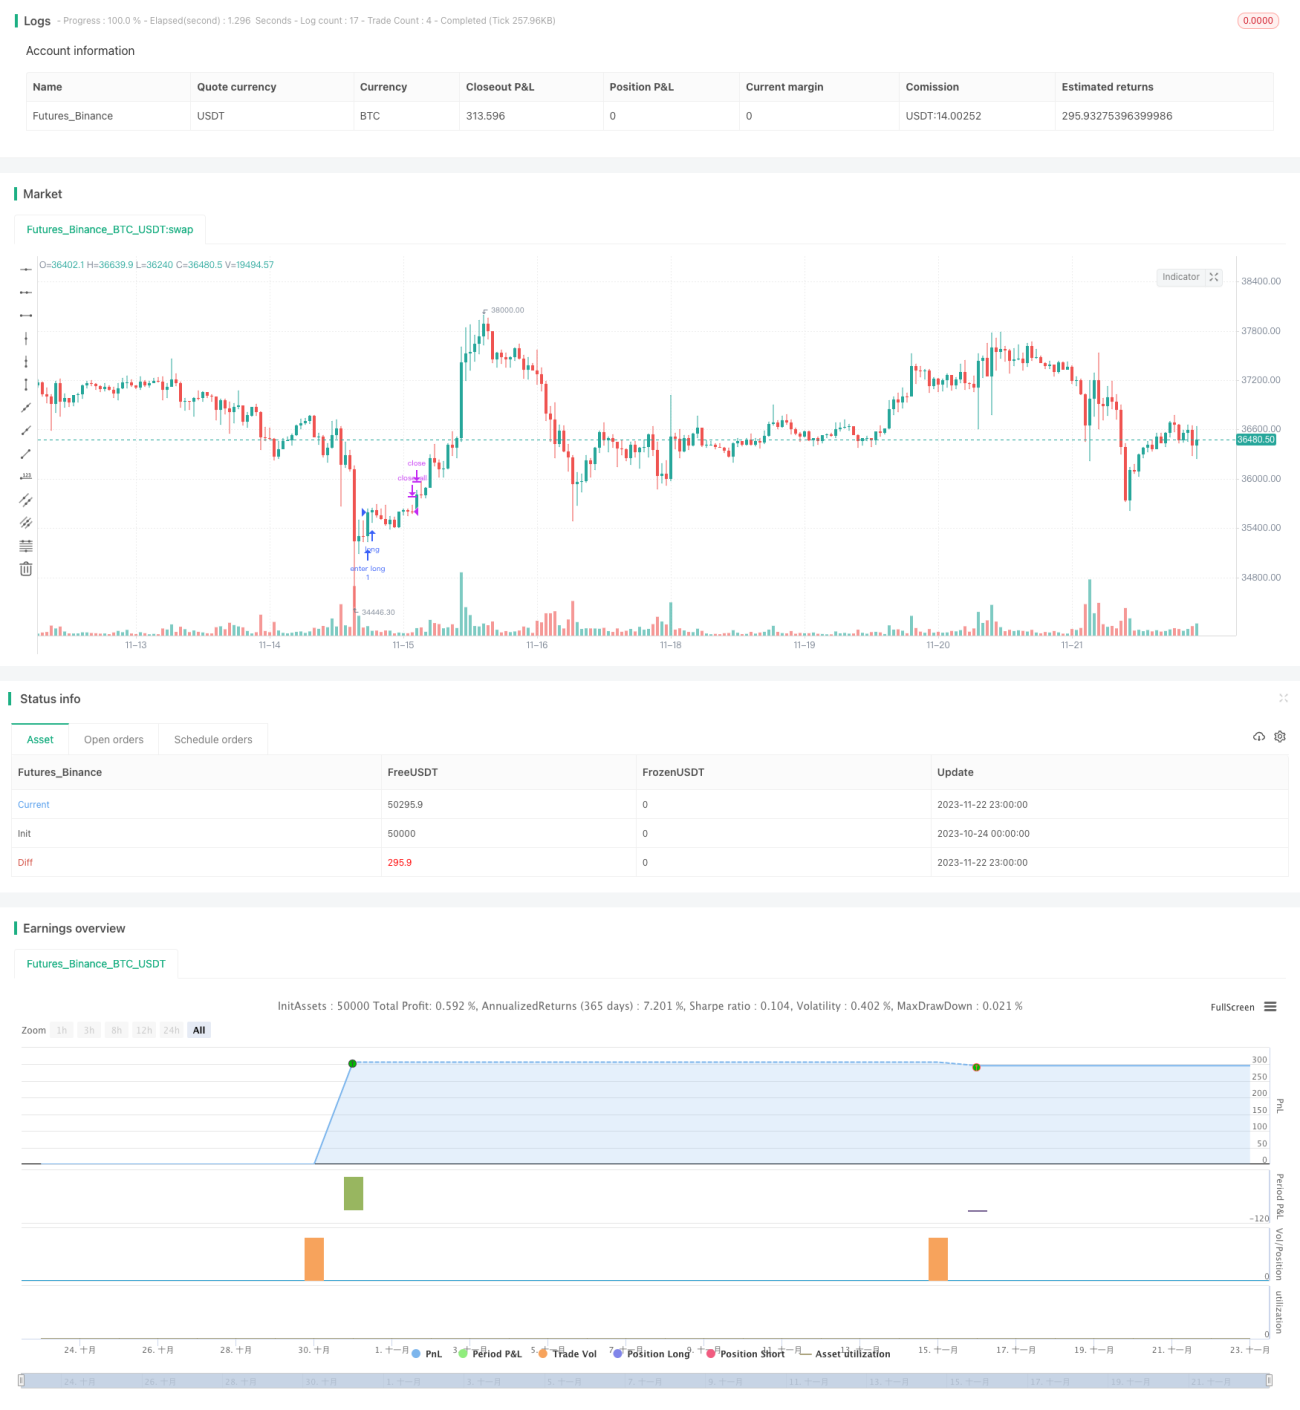
/*backtest
start: 2023-10-24 00:00:00
end: 2023-11-23 00:00:00
period: 1h
basePeriod: 15m
exchanges: [{"eid":"Futures_Binance","currency":"BTC_USDT"}]
*/
// This is an Open source work. Please do acknowledge in case you want to reuse whole or part of this code.
// Please see the documentation to know the details about this.
//@version=5
strategy('Strategy:Reversal-Catcher', shorttitle="Reversal-Catcher", overlay=true , currency=currency.NONE, initial_capital=100000)
// Inputs
src = input(close, title="Source (close, high, low, open etc.")
BBlength = input.int(defval=20, minval=1,title="Bollinger Period Length, default 20")
BBmult = input.float(defval=1.5, minval=1.0, maxval=4, step=0.1, title="Bollinger Bands Standard Deviation, default is 1.5")
fastMovingAvg = input.int(defval=21, minval=5,title="Fast Exponential Moving Average, default 21", group = "Trends")
slowMovingAvg = input.int(defval=50, minval=8,title="Slow Exponential Moving Average, default 50", group = "Trends")
rsiLenght = input.int(defval=14, title="RSI Lenght, default 14", group = "Momentum")
overbought = input.int(defval=70, title="Overbought limit (RSI), default 70", group = "Momentum")
oversold = input.int(defval=30, title="Oversold limit (RSI), default 30", group = "Momentum")
hide = input.bool(defval=true, title="Hide all plots and legends from the chart (default: true)")
// Trade related
tradeType = input.string(defval='Both', group="Trade settings", title="Trade Type", options=['Both', 'TrendFollowing', 'Reversal'], tooltip="Consider all types of trades? Or only Trend Following or only Reversal? (default: Both).")
endOfDay = input.int(defval=1500, title="Close all trades, default is 3:00 PM, 1500 hours (integer)", group="Trade settings")
mktAlwaysOn = input.bool(defval=false, title="Markets that never closed (Crypto, Forex, Commodity)", tooltip="Some markers never closes. For those cases, make this checked. (Default: off)", group="Trade settings")
// Utils
annotatePlots(txt, val, hide) =>
if (not hide)
var l1 = label.new(bar_index, val, txt, style=label.style_label_left, size = size.tiny, textcolor = color.white, tooltip = txt)
label.set_xy(l1, bar_index, val)
/////////////////////////////// Indicators /////////////////////
vwap = ta.vwap(src)
plot(hide ? na : vwap, color=color.purple, title="VWAP", style = plot.style_line)
annotatePlots('VWAP', vwap, hide)
// Bollinger Band of present time frame
[BBbasis, BBupper, BBlower] = ta.bb(src, BBlength, BBmult)
p1 = plot(hide ? na : BBupper, color=color.blue,title="Bollinger Bands Upper Line")
p2 = plot(hide ? na : BBlower, color=color.blue,title="Bollinger Bands Lower Line")
p3 = plot(hide ? na : BBbasis, color=color.maroon,title="Bollinger Bands Width", style=plot.style_circles, linewidth = 1)
annotatePlots('BB-Upper', BBupper, hide)
annotatePlots('BB-Lower', BBlower, hide)
annotatePlots('BB-Base(20-SMA)', BBbasis, hide)
// RSI
rsi = ta.rsi(src, rsiLenght)
// Trend following
ema50 = ta.ema(src, slowMovingAvg)
ema21 = ta.ema(src, fastMovingAvg)
annotatePlots('21-EMA', ema21, hide)
annotatePlots('50-EMA', ema50, hide)
// Trend conditions
upTrend = ema21 > ema50
downTrend = ema21 < ema50
// Condition to check Special Entry: HH_LL
// Long side:
hhLLong = barstate.isconfirmed and (low > low[1]) and (high > high[1]) and (close > high[1])
hhLLShort = barstate.isconfirmed and (low < low[1]) and (high < high[1]) and (close < low[1])
longCond = barstate.isconfirmed and (high[1] < BBlower[1]) and (close > BBlower) and (close < BBupper) and hhLLong and ta.crossover(rsi, oversold) and downTrend
shortCond = barstate.isconfirmed and (low[1] > BBupper[1]) and (close < BBupper) and (close > BBlower) and hhLLShort and ta.crossunder(rsi, overbought) and upTrend
// Trade execute
h = hour(time('1'), syminfo.timezone)
m = minute(time('1'), syminfo.timezone)
hourVal = h * 100 + m
totalTrades = strategy.opentrades + strategy.closedtrades
if (mktAlwaysOn or (hourVal < endOfDay))
// Entry
var float sl = na
var float target = na
if (longCond)
strategy.entry("enter long", strategy.long, 1, limit=na, stop=na, comment="Long[E]")
sl := low[1]
target := high >= BBbasis ? BBupper : BBbasis
alert('Buy:' + syminfo.ticker + ' ,SL:' + str.tostring(math.floor(sl)) + ', Target:' + str.tostring(target), alert.freq_once_per_bar)
if (shortCond)
strategy.entry("enter short", strategy.short, 1, limit=na, stop=na, comment="Short[E]")
sl := high[1]
target := low <= BBbasis ? BBlower : BBbasis
alert('Sell:' + syminfo.ticker + ' ,SL:' + str.tostring(math.floor(sl)) + ', Target:' + str.tostring(target), alert.freq_once_per_bar)
// Exit: target or SL
if ((close >= target) or (close <= sl))
strategy.close("enter long", comment=close < sl ? "Long[SL]" : "Long[T]")
if ((close <= target) or (close >= sl))
strategy.close("enter short", comment=close > sl ? "Short[SL]" : "Short[T]")
else if (not mktAlwaysOn)
// Close all open position at the end if Day
strategy.close_all(comment = "EoD[Exit]", alert_message = "EoD Exit", immediately = true)