Dual CCI Quantitative Strategy

Overview
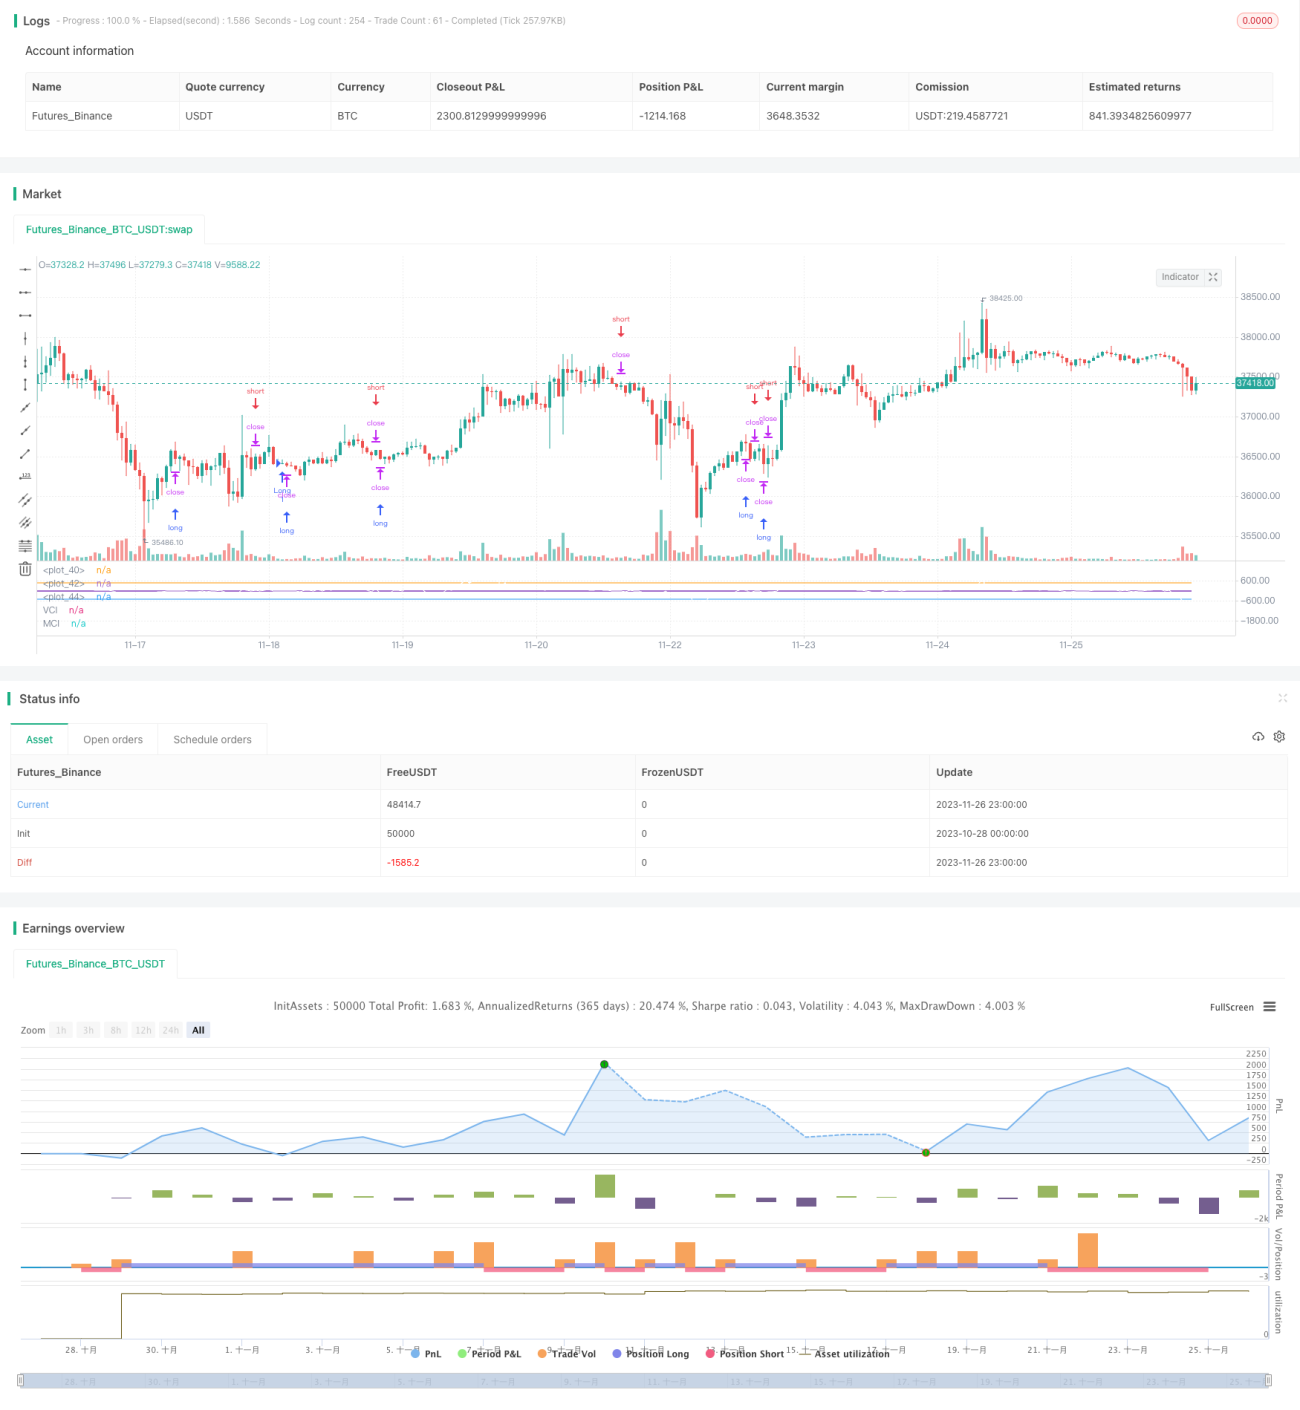
This strategy combines the classic technical indicator CCI and self-developed VCI and MCI dual indices to form trading signals, which is a typical quantitative trading strategy. By identifying the trend and momentum of Volume and Price changes, it determines the main direction of the current market and forms trading signals. It can be widely used for financial instruments such as digital currencies, foreign exchange and stocks.
Strategy Principle
- Calculate ohlc4 moving average and combine with cci indicator to judge price level;
- Calculate obv indicator to measure capital flow;
- Calculate VCI index, which measures the distribution of capital flow through the variance of obv indicator;
- Calculate MCI index, which measures the distribution of prices through the variance of prices;
- Compare VCI and MCI indices to judge market sentiment;
- VCI > MCI, strong buying interest;
- VCI < MCI, strong selling interest;
- Form long and short signals based on the comparison of VCI and MCI;
Advantage Analysis
- The strategy takes into account multiple dimensions such as price, trading volume and capital flow to judge market sentiment, with relatively accurate signals;
- VCI and MCI are calculated by dynamic standard deviation, which can adapt to real-time market changes;
- The strategy parameters have been optimized through extensive backtesting and have strong stability;
Risk Analysis
- The calculation of price and trading volume indicators lags and cannot capture sudden events in advance;
- A single strategy cannot fully cover complex and volatile market conditions;
- It needs to be combined with other auxiliary indicators and cannot solely judge the market;
Optimization Directions
- Incorporate predictive models such as deep learning to improve signal judgment accuracy;
- Add risk control modules such as stop loss to enhance strategy stability;
- Try different parameter combinations to test applicability in specific markets;
Conclusion
This strategy forms trading signals by comparing dual CCI indices, taking into account factors such as price and trading volume to assess market sentiment. It is a typical and practical quantitative trading strategy. But it still needs to be used with other auxiliary tools to maximize the effectiveness of the strategy. It is worthwhile to further optimize and expand applicable scenarios while reducing risks.
- 1