MACD Indicator Bottom Reversal Early Warning Strategy

Overview
The MACD Indicator Bottom Reversal Early Warning Strategy analyzes the fast and slow lines of the MACD indicator to determine whether the current price is at a historical high or low and whether a reversal will occur soon, in order to quickly judge the trend of market prices.
Strategy Principle
This strategy screens and filters the fast line and slow line data corresponding to the output of the standard MACD indicator to judge whether the price has entered the critical area before reversal and issues buy or sell signals.
Specifically, the strategy judges whether the price has entered the bottom area of an uptrend or the top area of a downtrend by calculating the golden cross and death cross of the fast and slow lines of the MACD. On golden crosses, if the close price is higher than the close price of the previous bar and the diff is higher than the diff value of the previous bar, it is determined that the bottom area has been entered and a bottom reversal early warning signal is issued. On death crosses, if the close price is lower than the close price of the previous bar and the diff of the previous bar is higher than the current diff value, it is determined that the top area has been entered and a top reversal early warning signal is issued.
Advantage Analysis
- Use MACD indicator for accurate judgment of market trend
- Bottom and top reversal early warning can capture reversal opportunities in time
- Avoid unnecessary misreporting by combining fast and slow line relationships
- Alerts can be added for real-time monitoring of market changes
Risk Analysis
- The MACD indicator itself has lagging judgment and cannot determine the exact reversal point
- Need to adjust parameters appropriately to suit different trading varieties and time frames
- Unable to determine the specific reversal amplitude and trend after reversal
- Need to monitor changes in trading volume at the same time to determine the reliability of reversal
Solutions:
- Combine with other indicators such as K-line patterns and changes in trading volume for judgment
- Adjust parameters to suit different trading varieties and time frames
- Timely stop loss to control risks
Optimization Directions
- Optimize MACD indicator parameters for better judgment of bottoms and tops
- Increase stop loss logic to avoid loss enlargement
- Combine trading volume changes to determine reliability of reversals
- Increase machine learning model to determine probability of reversal
Conclusion
The MACD Indicator Bottom Reversal Early Warning Strategy can effectively discover bottoms and tops to provide guidance for trading decisions by analyzing MACD fast and slow line crosses to judge whether prices have entered the critical area before reversal. However, the lagging judgment of the MACD itself cannot determine the exact reversal point and reversal momentum. Therefore, appropriate parameter adjustments are needed, combined with other indicators, to control risks and leverage the effectiveness of this strategy. In the future, the introduction of machine learning techniques can further improve judgment accuracy.
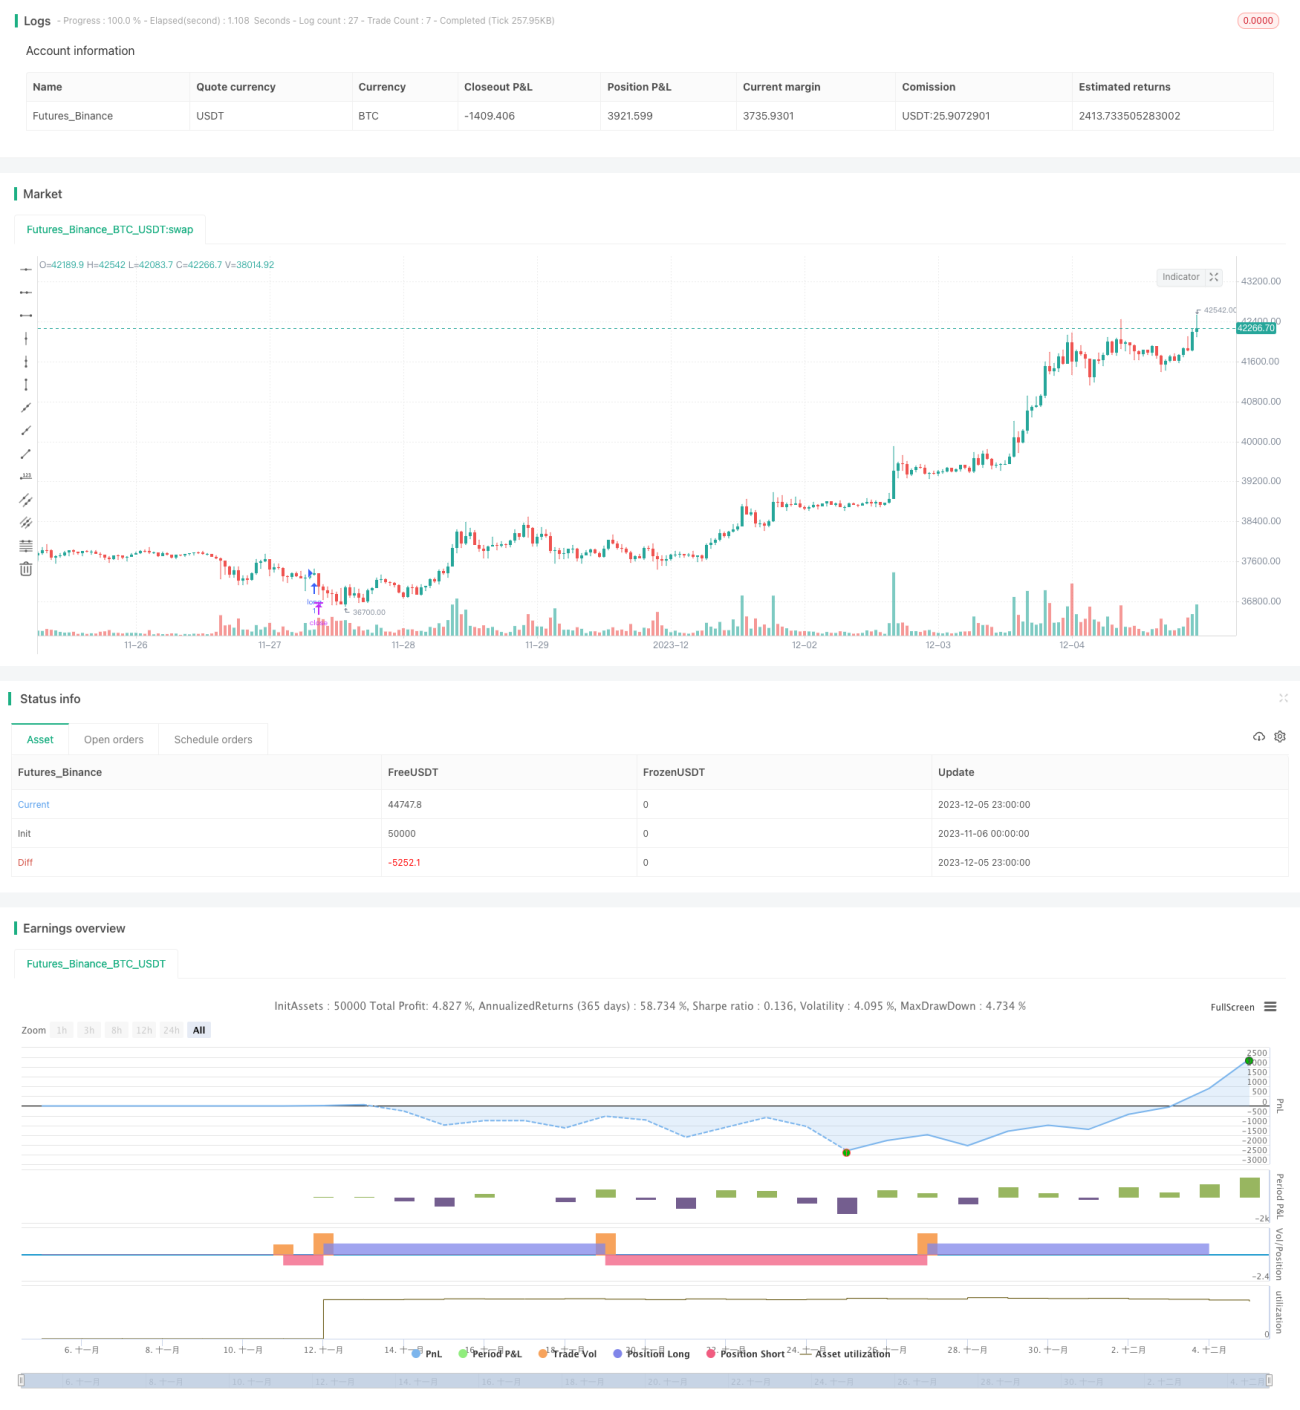
/*backtest
start: 2023-11-06 00:00:00
end: 2023-12-06 00:00:00
period: 1h
basePeriod: 15m
exchanges: [{"eid":"Futures_Binance","currency":"BTC_USDT"}]
*/

    // ____  __    ___   ________ ___________  ___________ __  ____ ___
   // / __ )/ /   /   | / ____/ //_/ ____/   |/_  __<  / // / / __ |__ \
  // / __  / /   / /| |/ /   / ,< / /   / /| | / /  / / // /_/ / / __/ /
// / /_/ / /___/ ___ / /___/ /| / /___/ ___ |/ / / /__ __/ /_/ / __/ - 1