
This strategy combines dual EMA golden crosses, normalized ATR noise filter, and ADX trend indicator to provide more reliable buy signals for traders. It integrates multiple indicators to filter out false signals and identify more reliable trading opportunities.
The strategy uses 8-period and 20-period EMAs to build a dual EMA golden cross system. It generates buy signals when the shorter period EMA crosses above the longer period EMA.
In addition, the strategy has set up several auxiliary indicators for filtering:
14-period ATR, normalized to filter out minor price fluctuations in the market.
14-period ADX to identify the strength of trends. Trades are considered only in strong trends.
14-period SMA of volume to filter out time points with small trading volumes.
4⁄14-period Super Trend indicator to judge bullish or bearish market direction.
Only when the trend direction, normalized ATR value, ADX level and volume conditions are met, the EMA golden cross will eventually trigger the buy signal.
Integrating indicators like EMA, ATR, ADX and Super Trend forms a strong signal filtering system, higher reliability.
Threshold values of normalized ATR, ADX, holding period etc. can be optimized, higher flexibility.
Identify bull and bear markets using Super Trend, avoid missing opportunities.
Too many parameters, difficulty in finding the optimum combination.
There is still risk of false signals due to lagging nature of indicators. Proper stop loss theory needs consideration.
Frequency tends to be low due to multiple filters, long no-trade duration possible.
Finding optimum combination requires large amount of backtesting data.
Use ML algorithms to automatically optimize parameters over time. Improve adaptiveness.
Combining indicators of market structure, emotions etc. improves diversity.
This strategy comprehensively considers trend, volatility and volume price factors. Through multi-indicator filtering and parameter tuning, it forms a reliable trading system. The reliability is high and can be further improved via optimization.
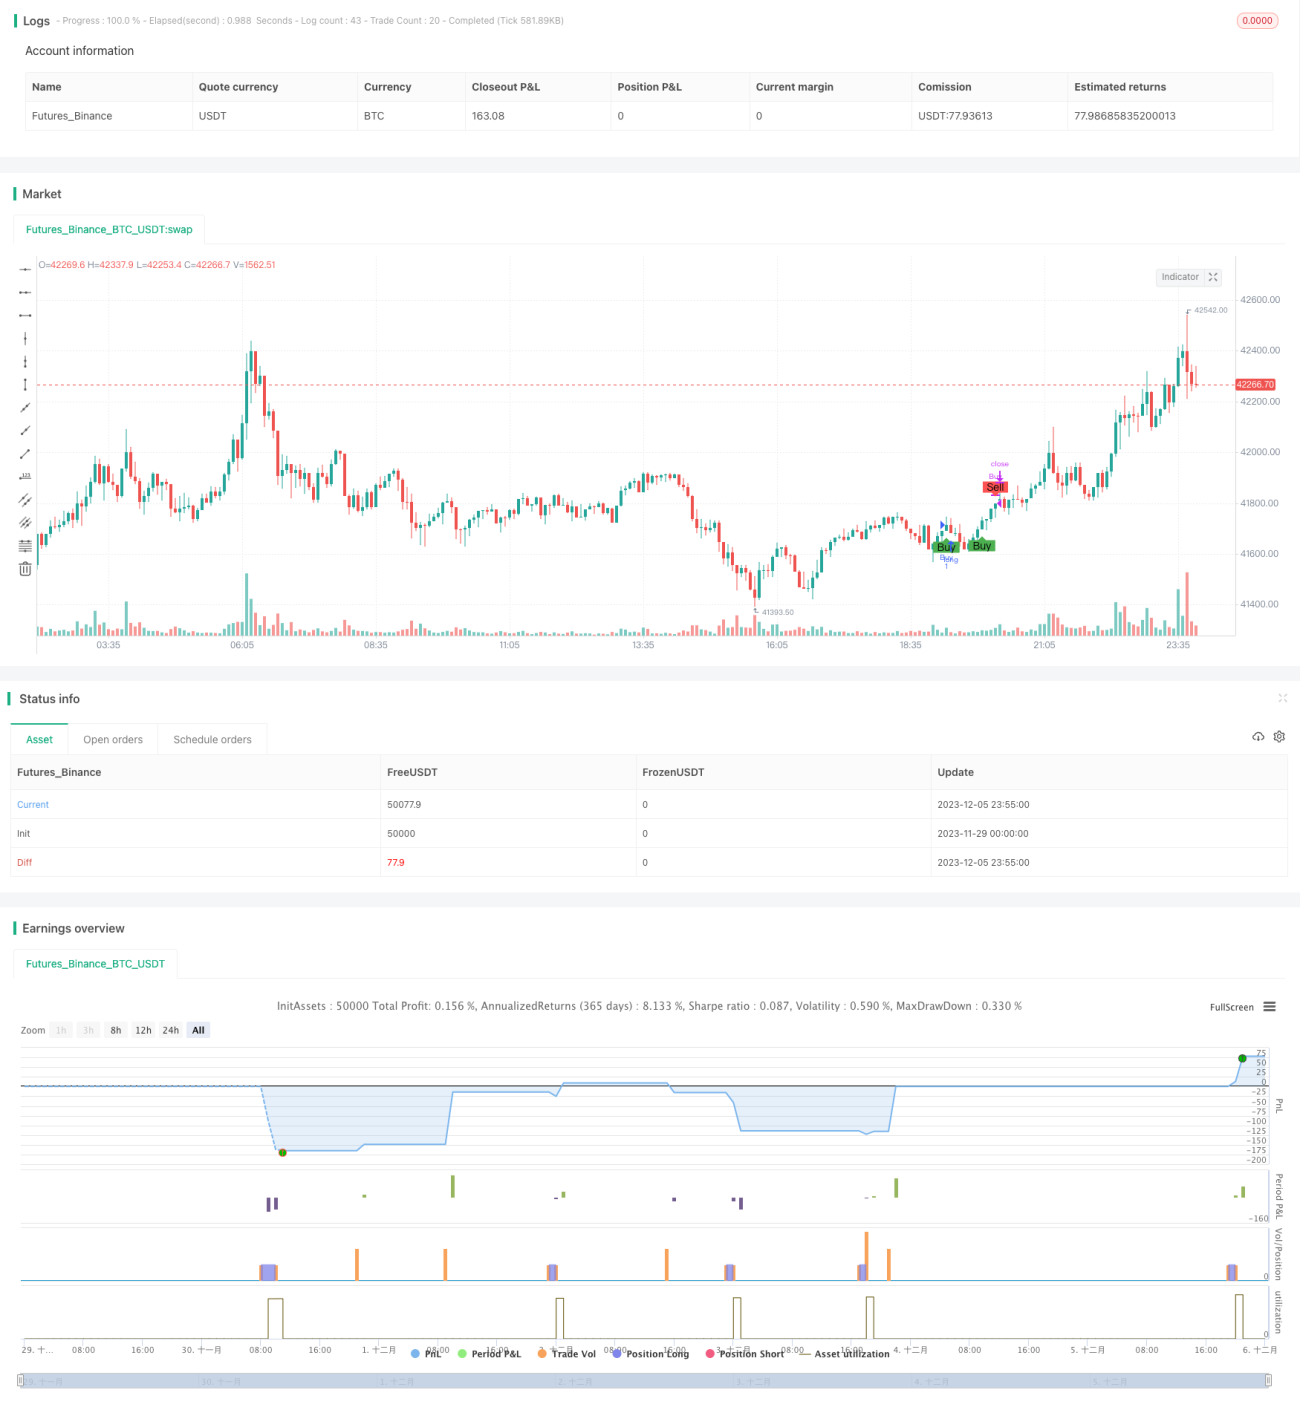
/*backtest
start: 2023-11-29 00:00:00
end: 2023-12-06 00:00:00
period: 5m
basePeriod: 1m
exchanges: [{"eid":"Futures_Binance","currency":"BTC_USDT"}]
*/
//Description:
//This strategy is a refactored version of an EMA cross strategy with a normalized ATR filter and ADX control.
//It aims to provide traders with signals for long positions based on market conditions defined by various indicators.
//How it Works:
//1. EMA: Uses short (8 periods) and long (20 periods) EMAs to identify crossovers.
//2. ATR: Uses a 14-period ATR, normalized to its 20-period historical range, to filter out noise.
//3. ADX: Uses a 14-period RMA to identify strong trends.
//4. Volume: Filters trades based on a 14-period SMA of volume.
//5. Super Trend: Uses a Super Trend indicator to identify the market direction.
//How to Use:
//- Buy Signal: Generated when EMA short crosses above EMA long, and other conditions like ATR and market direction are met.
//- Sell Signal: Generated based on EMA crossunder and high ADX value.
//Originality and Usefulness:
//This script combines EMA, ATR, ADX, and Super Trend indicators to filter out false signals and identify more reliable trading opportunities.
//USD Strength is not working, just simulated it as PSEUDO CODE: [close>EMA(50)]
//Strategy Results:
//- Account Size: $1000
//- Commission: Not considered
//- Slippage: Not considered
//- Risk: Less than 5% per trade
//- Dataset: Aim for more than 100 trades for sufficient sample size
//Note: This script should be used for educational purposes and should not be considered as financial advice.
//Chart:
//- The script's output is plotted as Buy and Sell signals on the chart.
//- No other scripts are included for clarity.
//- Have tested with 30mins period
//- You are encouraged to play with parameters, let me know if you
//@version=5
strategy("Advanced EMA Cross with Normalized ATR Filter, Controlling ADX", shorttitle="ALP V5", overlay=true )
// Initialize variables
var bool hasBought = false
var int barCountSinceBuy = 0
// Define EMA periods
emaShort = ta.ema(close, 8)
emaLong = ta.ema(close, 20)
// Define ATR parameters
atrLength = 14
atrValue = ta.atr(atrLength)
maxHistoricalATR = ta.highest(atrValue, 20)
minHistoricalATR = ta.lowest(atrValue, 20)
normalizedATR = (atrValue - minHistoricalATR) / (maxHistoricalATR - minHistoricalATR)
// Define ADX parameters
adxValue = ta.rma(close, 14)
adxHighLevel = 30
isADXHigh = adxValue > adxHighLevel
// Initialize risk management variables
var float stopLossPercent = na
var float takeProfitPercent = na
// Calculate USD strength
// That's not working as usd strenght, since I couldn't manage to get usd strength
//I've just simulated it as if the current close price is above 50 days average (it's likely a bullish trend), usd is strong (usd_strenth variable is positive)
usd_strength = close / ta.ema(close, 50) - 1
// Adjust risk parameters based on USD strength
if (usd_strength > 0)
stopLossPercent := 3
takeProfitPercent := 6
else
stopLossPercent := 4
takeProfitPercent := 8
// Initialize position variable
var float positionPrice = na
// Volume filter
minVolume = ta.sma(volume, 14) * 1.5
isVolumeHigh = volume > minVolume
// Market direction using Super Trend indicator
[supertrendValue, supertrendDirection] = ta.supertrend(4, 14)
bool isBullMarket = supertrendDirection < 0
bool isBearMarket = supertrendDirection > 0
// Buy conditions for Bull and Bear markets
buyConditionBull = isBullMarket and ta.crossover(emaShort, emaLong) and normalizedATR > 0.2
buyConditionBear = isBearMarket and ta.crossover(emaShort, emaLong) and normalizedATR > 0.5
buyCondition = buyConditionBull or buyConditionBear
// Sell conditions for Bull and Bear markets
sellConditionBull = isBullMarket and (ta.crossunder(emaShort, emaLong) or isADXHigh)
sellConditionBear = isBearMarket and (ta.crossunder(emaShort, emaLong) or isADXHigh)
sellCondition = sellConditionBull or sellConditionBear
// Final Buy and Sell conditions
if (buyCondition)
strategy.entry("Buy", strategy.long)
positionPrice := close
hasBought := true
barCountSinceBuy := 0
if (hasBought)
barCountSinceBuy := barCountSinceBuy + 1
// Stop-loss and take-profit levels
longStopLoss = positionPrice * (1 - stopLossPercent / 100)
longTakeProfit = positionPrice * (1 + takeProfitPercent / 100)
// Final Sell condition
finalSellCondition = sellCondition and hasBought and barCountSinceBuy >= 3 and isVolumeHigh
if (finalSellCondition)
strategy.close("Buy")
positionPrice := na
hasBought := false
barCountSinceBuy := 0
// Implement stop-loss and take-profit
strategy.exit("Stop Loss", "Buy", stop=longStopLoss)
strategy.exit("Take Profit", "Buy", limit=longTakeProfit)
// Plot signals
plotshape(series=buyCondition, title="Buy Signal", location=location.belowbar, color=color.green, style=shape.labelup, text="Buy")
plotshape(series=finalSellCondition, title="Sell Signal", location=location.abovebar, color=color.red, style=shape.labeldown, text="Sell")