Fibonacci Retracement Reversal Strategy

Overview
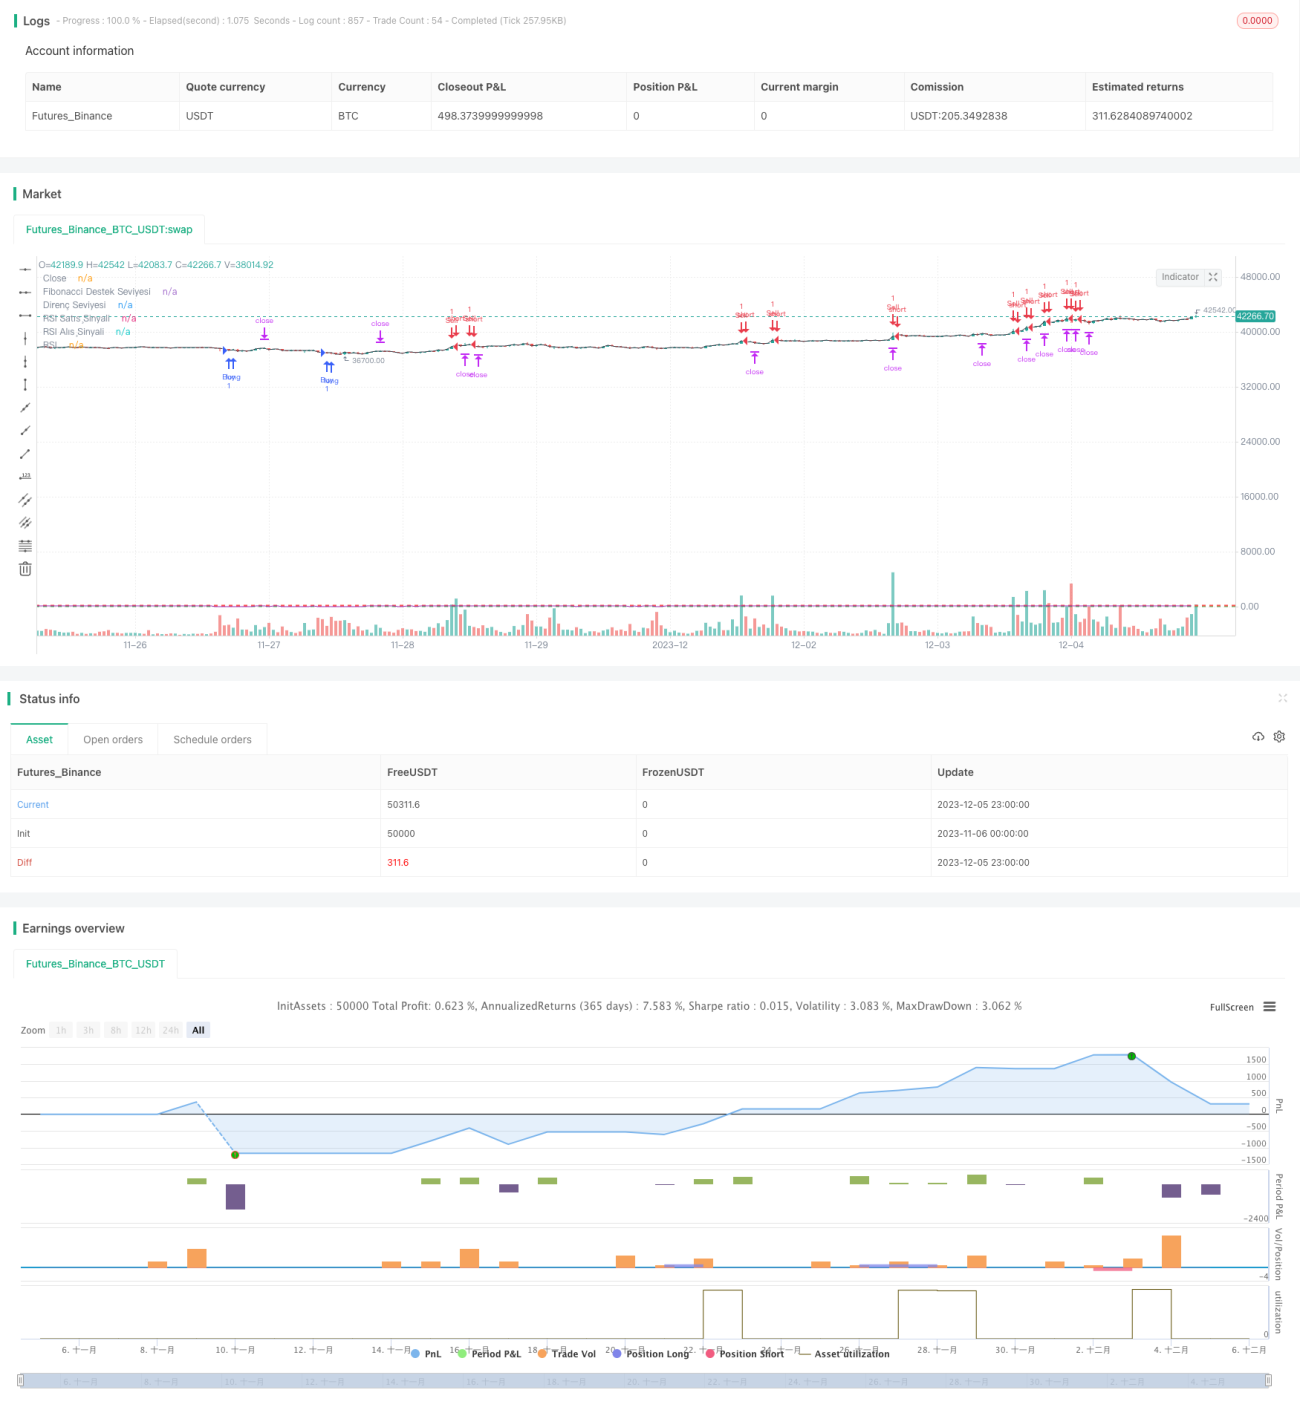
The Fibonacci Retracement Reversal strategy is a quantitative trading strategy based on Fibonacci retracement levels and the Relative Strength Index (RSI) indicator. This strategy combines the Fibonacci channel theory and overbought/oversold indicator to make reversal trades against the major trend in order to profit in the short-term cycles.
Strategy Logic
The strategy first calculates two important price zones based on the 0.618 Fibonacci levels - the 0.618 times high point and 0.618 times low point. When prices approach these areas, we believe a reversal may occur.
In addition, the strategy also uses the RSI indicator to determine overbought/oversold conditions. RSI below 30 indicates oversold status while RSI above 70 suggests overbought condition. These also imply potential price reversals.
Combining the two conditions, the buy signal is triggered when: close breaks above the 0.618 times low point AND RSI is below 30; the sell signal triggers when: close breaks below the 0.618 times high point AND RSI goes over 70.
Upon buy signal, the strategy will long at market price. Upon sell signal, it will short at market price. Also, take profit and stop loss levels are set so that the position will be closed when price moves favorably by certain percentage (take profit) or moves adversely by certain percentage (stop loss).
Pros
The strategy combines both trend and reversal scenarios, taking into account major trend while profiting from short-term retracement. The main advantages are:
- Fibonacci levels have inherent support/resistance attributes, serving as effective price zone indicator.
- RSI overbought/oversold status suggests potential turning points.
- Long/short signals are clear, catching reversal chances.
- Take profit/stop loss controls risk.
Risks
There are some risks to be awared of:
- Losses may occur if no major trend reversal happens despite short-term bounces. Larger timeframe analysis can help avoid this.
- Stop loss may be triggered before reversal happens. Wider stop loss zone could help.
- Reversals may sustain for long time, requiring sufficient capital support.
Optimization
The strategy can be further optimized by:
-
Collect more historical data to test and tune key parameters like Fibonacci zone range and RSI overbought/oversold lines for better fit to real market.
-
Incorporate more indicators to generate stronger signals, like candlestick patterns, volume changes etc.
-
Adjust parameters or rules according to different trading instruments' characteristics.
-
Add dynamic stop loss mechanism to trail price real-time.
Conclusion
The Fibonacci Retracement Reversal strategy balances trend and reversal scenarios to profit in short-term while controlling risks. Further optimizations may lead to greater returns.
- 1