Overview
This strategy combines Directional Movement Index (ADX), Plus Directional Indicator (DI+) and fast and slow moving averages to determine market direction and holding period. It belongs to trend-following trading strategies. The strategy can effectively capture reversal points on medium and short terms and performs well in low volatility and obvious trending markets.
Principles
The core logic of this strategy is to generate buy signals when the +DI line crosses above the ADX line from the bottom up, and generate sell signals when the +DI line crosses below the ADX line from the top down. Therefore, this strategy relies on the crossover between DI and ADX to determine market trends and reversal points. At the same time, the relationship between fast and slow moving averages is used to determine the overall market trend. Trading signals will only be considered when the fast EMA is above the slow EMA.
Specifically, a buy signal will be triggered when the following conditions are met:
1. Fast EMA is above slow EMA
2. +DI line crosses ADX line upward
3. ADX value is below 30 threshold
A sell signal will be triggered when the following conditions are met:
1. ADX value exceeds 30 threshold
2. +DI line crosses ADX line downward
The strategy also incorporates stop loss logic to exit all positions when the price falls below the stop loss level.
Advantages
The strategy combines DI, ADX and moving average indicators to effectively determine turns in market trends. The main advantages are:
- Utilize DI and ADX crossovers to accurately determine entry and exit points
- Fast and slow EMA filter system to determine overall market trend, avoiding bad trades
- Use ADX values to determine trend strength, only trading when trend is weak, avoiding false breakouts
- Incorporate stop loss mechanism to control downside risk
- Strict entry conditions avoid buying tops and selling bottoms
- Clear exit rules allow for timely stop losses and profit taking
Risks
There are some risks to note with this strategy:
- ADX indicator has lagging effect, could miss best timing for price reversals
- More false signals may occur when market volatility is high
- Improper fast and slow EMA settings could lead to missing trades or filtering valid signals
- Stop loss level set too wide fails to effectively control risk
These risks can be addressed through optimizing ADX and moving average parameters, adjusting stop loss level, adding filters for confirmation etc.
Enhancement Opportunities
There is room for further enhancements:
- Test ADX of different length periods to find optimal combinations
- Add other indicators like RSI, Bollinger Bands for signal confirmation
- Utilize machine learning algorithms to automatically optimize parameters and rules
- Dynamically adjust stop loss levels to mitigate late stage risks
- Build multifactor scoring model to make entry and exit criteria more robust
Conclusion
In general this ADX crossover trend strategy is quite stable, able to effectively capture reversals early on, but risk control is critical. Further optimizing parameters, strictly following entry rules and stop loss can lead to good risk-adjusted returns. The strategy suits long-term accounts holding medium to short term positions.
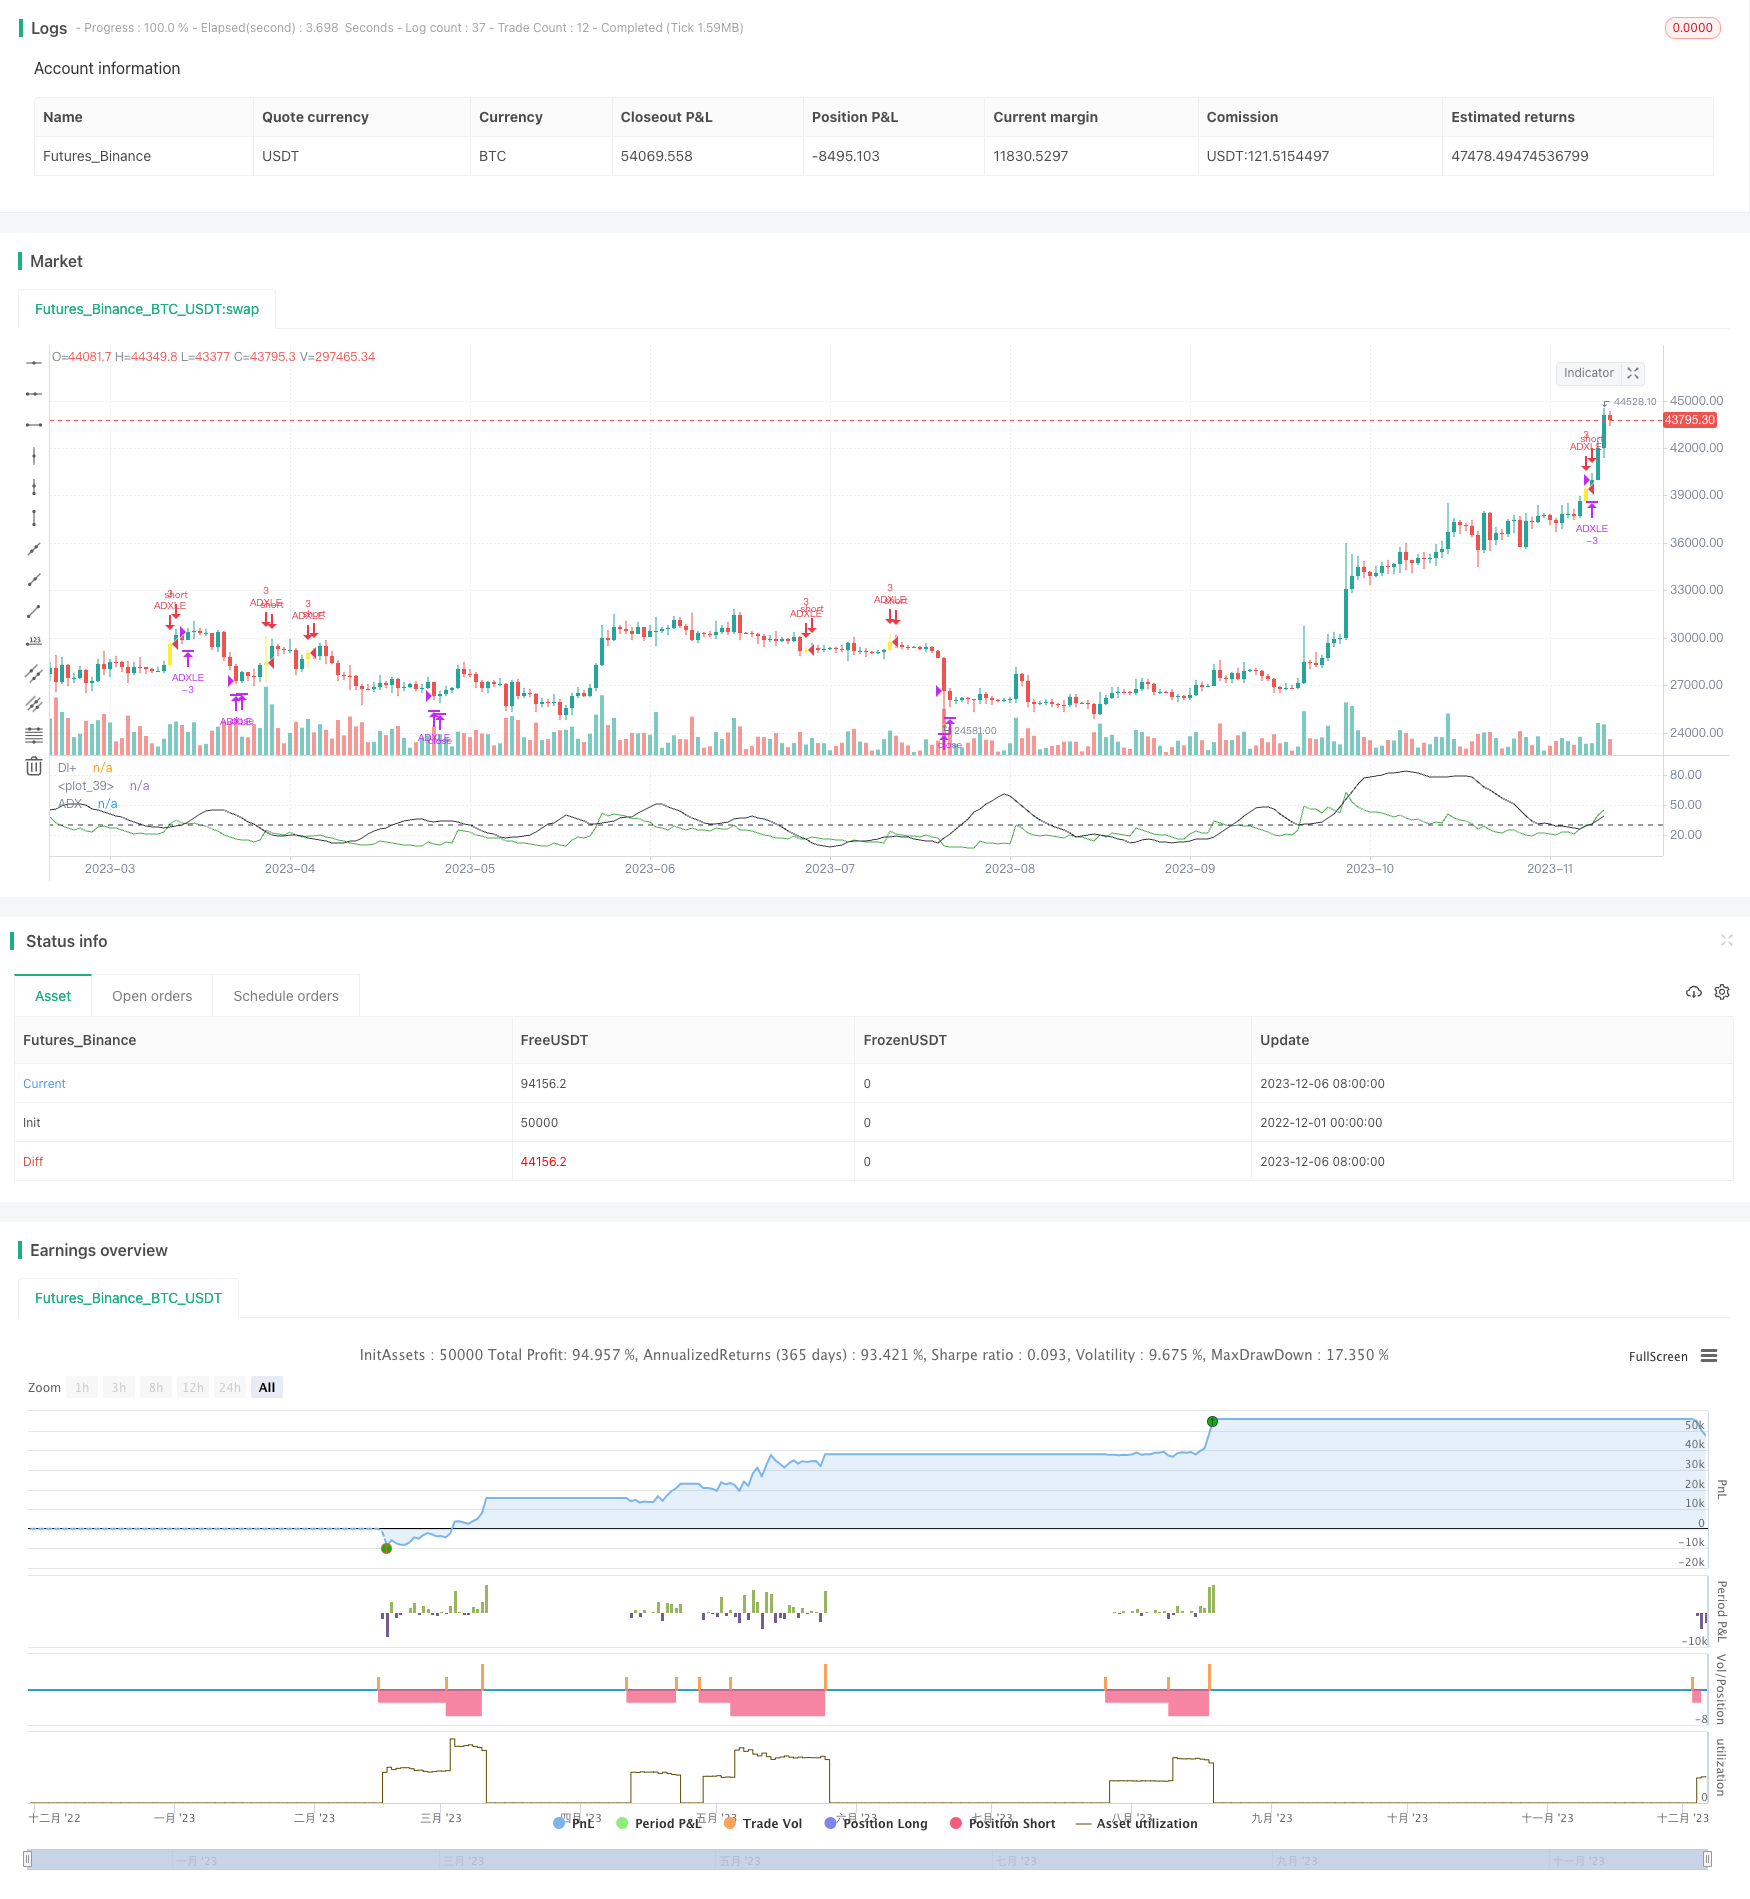
/*backtest
start: 2022-12-01 00:00:00
end: 2023-12-07 00:00:00
period: 1d
basePeriod: 1h
exchanges: [{"eid":"Futures_Binance","currency":"BTC_USDT"}]
*/

// This source code is subject to the terms of the Mozilla Public License 2.0 at https://mozilla.org/MPL/2.0/
// © mohanee

//@version=4
//ADX strategy
SmoothedTrueRange=0.00
SmoothedDirectionalMovementPlus=0.00
SmoothedDirectionalMovementMinus=0.00


strategy(title="ADX strategy", overlay=false,pyramiding=3, default_qty_type=strategy.fixed, default_qty_value=3,    initial_capital=10000, currency=currency.USD)

len = input(11, title="ADX Length", minval=1)
threshold = input(30, title="threshold", minval=5)

fastEma=input(13, title="Fast EMA",minval=1, maxval=50)
slowEma=input(55, title="Slow EMA",minval=10, maxval=200)
stopLoss =input(8, title="Stop Loss",minval=1)   //


TrueRange = max(max(high-low, abs(high-nz(close[1]))), abs(low-nz(close[1])))
DirectionalMovementPlus = high-nz(high[1]) > nz(low[1])-low ? max(high-nz(high[1]), 0): 0
DirectionalMovementMinus = nz(low[1])-low > high-nz(high[1]) ? max(nz(low[1])-low, 0): 0


SmoothedTrueRange:= nz(SmoothedTrueRange[1]) - (nz(SmoothedTrueRange[1])/len) + TrueRange

SmoothedDirectionalMovementPlus := nz(SmoothedDirectionalMovementPlus[1]) - (nz(SmoothedDirectionalMovementPlus[1])/len) + DirectionalMovementPlus
SmoothedDirectionalMovementMinus:= nz(SmoothedDirectionalMovementMinus[1]) - (nz(SmoothedDirectionalMovementMinus[1])/len) + DirectionalMovementMinus

DIPlus = SmoothedDirectionalMovementPlus / SmoothedTrueRange * 100
DIMinus = SmoothedDirectionalMovementMinus / SmoothedTrueRange * 100
DX = abs(DIPlus-DIMinus) / (DIPlus+DIMinus)*100
ADX = sma(DX, len)

plot(DIPlus, color=color.green, title="DI+")
//plot(DIMinus, color=color.red, title="DI-")
plot(ADX, color=color.black, title="ADX")
hline(threshold, color=color.black, linestyle=hline.style_dashed)

fastEmaVal=ema(close,fastEma)
slowEmaVal=ema(close,slowEma)


//long condition
longCondition=  ADX < threshold  and crossover(DIPlus,ADX)  and fastEmaVal > slowEmaVal


barcolor(longCondition ? color.yellow: na)

strategy.entry(id="ADXLE", long=true,  when= longCondition  and strategy.position_size<1)

barcolor(strategy.position_size>1 ? color.blue: na)
bgcolor(strategy.position_size>1 ? color.blue: na)


//Add
strategy.entry(id="ADXLE", comment="Add", long=true,  when= strategy.position_size>1 and close<strategy.position_avg_price and crossover(DIPlus,ADX) )


//calculate stop Loss
stopLossVal =  strategy.position_avg_price -  (strategy.position_avg_price*stopLoss*0.01)

strategy.close(id="ADXLE",comment="SL Exit",    when=close<stopLossVal)   //close all on stop loss


//exit condition
exitCondition=  ADX > threshold  and crossunder(DIPlus,ADX) // and fastEmaVal > slowEmaVal
strategy.close(id="ADXLE",comment="TPExitAll",    qty=strategy.position_size ,   when= exitCondition)   //close all