
This strategy uses 8 exponential moving averages (EMAs) of different periods and the Ichimoku cloud as the main trading signals, which can run effectively in hourly, 4-hour or daily timeframes.
The core principles of this strategy are based on the following two parts:
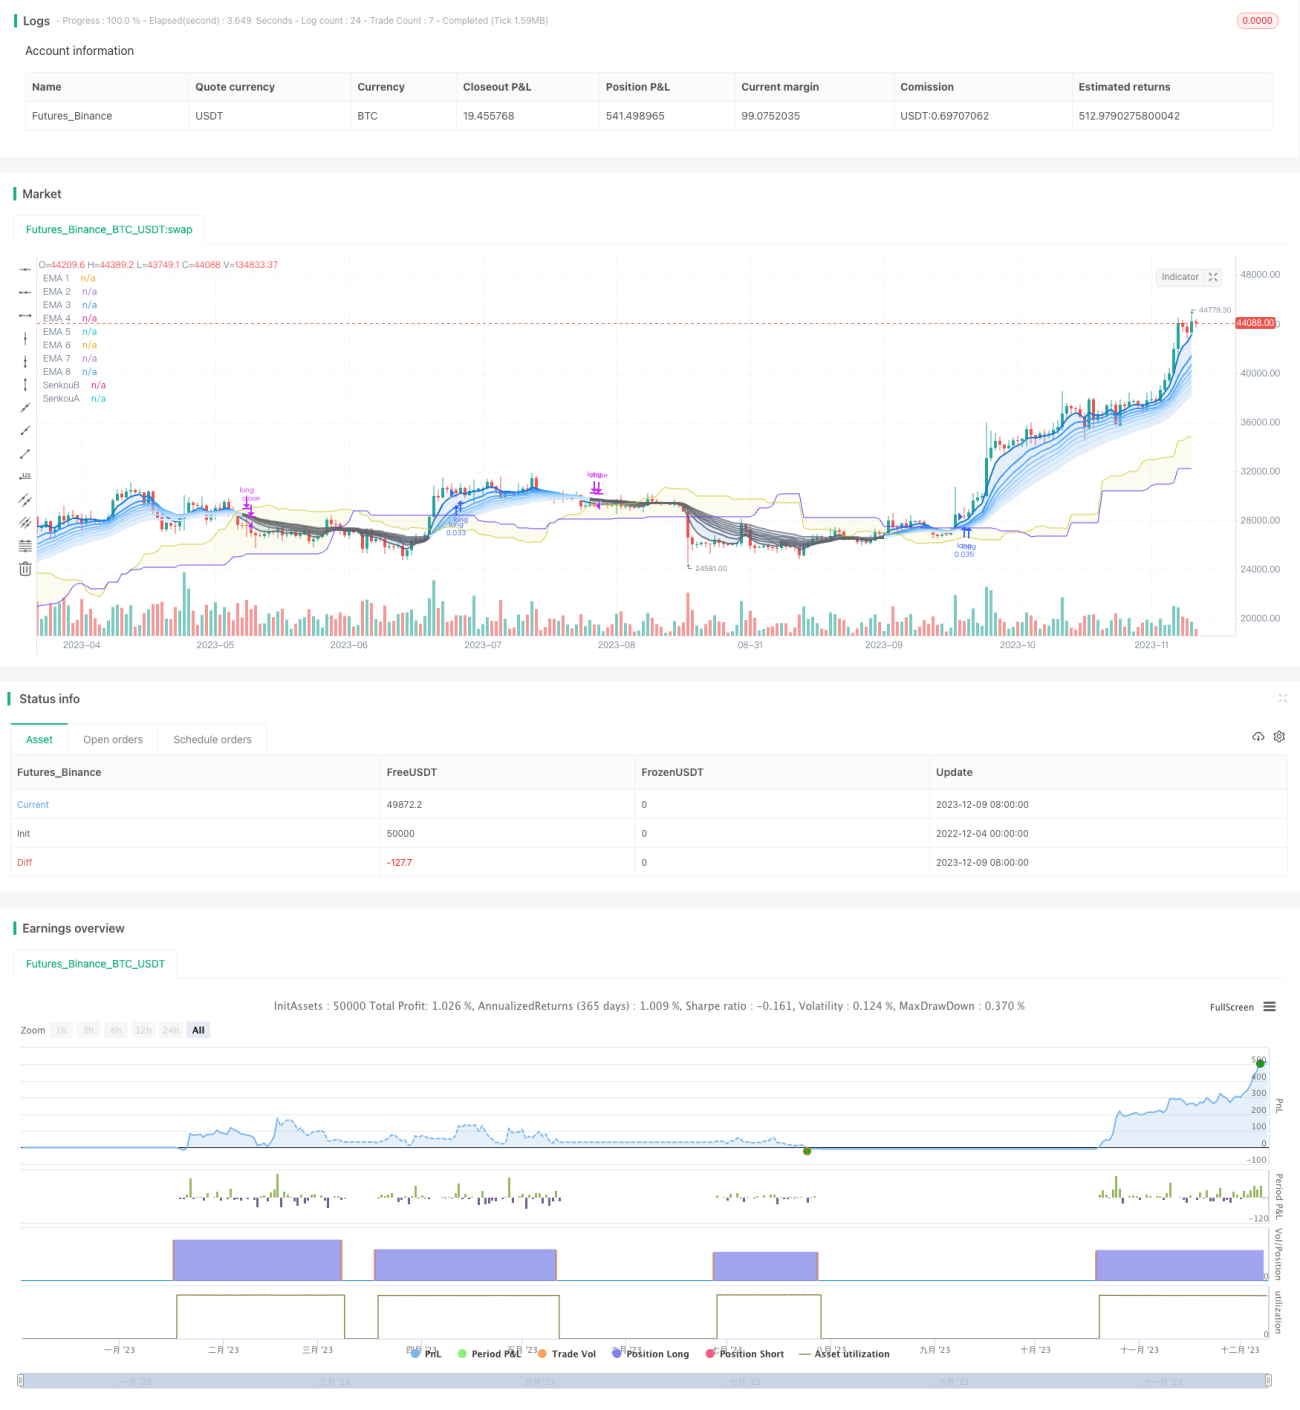
This strategy uses 8 EMAs with different periods, specifically 5-day, 11-day, 15-day, 18-day, 21-day, 24-day, 28-day and 34-day. These 8 EMAs are referred to as “Octa-EMA”. When shorter period EMAs are above longer period EMAs, it indicates an uptrend, and vice versa for a downtrend.
The Ichimoku cloud contains the conversion line, base line, lagging span and leading spans A/B. The cloud mainly judges trend direction and provides support/resistance. When price is above the cloud, it indicates an uptrend, and when below the cloud, it indicates a downtrend.
The trading signals for this strategy come from the combination of the above two components. A buy signal is generated when all 8 EMAs are in an uptrend arrangement (shorter EMA above longer EMA) and the price is above the Ichimoku cloud. A sell signal is generated when the EMA arrangement flips to a downtrend (shorter EMA crossing below longer EMA).
The main advantages of this strategy are:
This strategy also has some risks:
To address these risks, parameters can be adjusted or entry conditions optimized to reduce risk. Other indicators can also be incorporated for confirmation.
This strategy can be optimized in several aspects:
Overall, the Octa-EMA and Ichimoku cloud strategy is a relatively stable and reliable trend following system. It uses EMA crossovers to determine trends and Ichimoku to filter signals, providing low false signals when optimized. This strategy can be widely applied on indices, forex, metals etc. at multiple timeframes. By incorporating stop loss/take profit and confirming indicators, win rate and profitability can be further improved.
/*backtest
start: 2022-12-04 00:00:00
end: 2023-12-10 00:00:00
period: 1d
basePeriod: 1h
exchanges: [{"eid":"Futures_Binance","currency":"BTC_USDT"}]
*/
//@version=5
//Fukuiz
strategy(title='Fukuiz Octa-EMA + Ichimoku', shorttitle='Fuku octa strategy', overlay=true, process_orders_on_close=true,
default_qty_type= strategy.cash , default_qty_value=1000, currency=currency.USD, initial_capital=10000 ,commission_type = strategy.commission.percent,commission_value=0.25)
//OCTA EMA ##################################################
// Functions
f_emaRibbon(_src, _e1, _e2, _e3, _e4, _e5, _e6, _e7, _e8) =>
_ema1 = ta.ema(_src, _e1)
_ema2 = ta.ema(_src, _e2)
_ema3 = ta.ema(_src, _e3)
_ema4 = ta.ema(_src, _e4)
_ema5 = ta.ema(_src, _e5)
_ema6 = ta.ema(_src, _e6)
_ema7 = ta.ema(_src, _e7)
_ema8 = ta.ema(_src, _e8)
[_ema1, _ema2, _ema3, _ema4, _ema5, _ema6, _ema7, _ema8]
showRibbon = input(true, 'Show Ribbon (EMA)')
ema1Len = input(5, title='EMA 1 Length')
ema2Len = input(11, title='EMA 2 Length')
ema3Len = input(15, title='EMA 3 Length')
ema4Len = input(18, title='EMA 4 Length')
ema5Len = input(21, title='EMA 5 Length')
ema6Len = input(24, title='EMA 6 Length')
ema7Len = input(28, title='EMA 7 Length')
ema8Len = input(34, title='EMA 8 Length')
[ema1, ema2, ema3, ema4, ema5, ema6, ema7, ema8] = f_emaRibbon(close, ema1Len, ema2Len, ema3Len, ema4Len, ema5Len, ema6Len, ema7Len, ema8Len)
//Plot
ribbonDir = ema8 < ema2
p1 = plot(ema1, color=showRibbon ? ribbonDir ? #1573d4 : color.new(#5d606b, 15) : na, linewidth=2, title='EMA 1')
p2 = plot(ema2, color=showRibbon ? ribbonDir ? #3096ff : color.new(#5d606b, 15) : na, linewidth=2, title='EMA 2')
plot(ema3, color=showRibbon ? ribbonDir ? #57abff : color.new(#5d606b, 15) : na, linewidth=2, title='EMA 3')
plot(ema4, color=showRibbon ? ribbonDir ? #85c2ff : color.new(#5d606b, 15) : na, linewidth=2, title='EMA 4')
plot(ema5, color=showRibbon ? ribbonDir ? #9bcdff : color.new(#5d606b, 30) : na, linewidth=2, title='EMA 5')
plot(ema6, color=showRibbon ? ribbonDir ? #b3d9ff : color.new(#5d606b, 30) : na, linewidth=2, title='EMA 6')
plot(ema7, color=showRibbon ? ribbonDir ? #c9e5ff : color.new(#5d606b, 30) : na, linewidth=2, title='EMA 7')
p8 = plot(ema8, color=showRibbon ? ribbonDir ? #dfecfb : color.new(#5d606b, 30) : na, linewidth=2, title='EMA 8')
fill(p1, p2, color.new(#1573d4, 85))
fill(p2, p8, color.new(#1573d4, 85))
//ichimoku##################################################
//color
colorblue = #3300CC
colorred = #993300
colorwhite = #FFFFFF
colorgreen = #CCCC33
colorpink = #CC6699
colorpurple = #6633FF
//switch
switch1 = input(false, title='Chikou')
switch2 = input(false, title='Tenkan')
switch3 = input(false, title='Kijun')
middleDonchian(Length) =>
lower = ta.lowest(Length)
upper = ta.highest(Length)
math.avg(upper, lower)
//Functions
conversionPeriods = input.int(9, minval=1)
basePeriods = input.int(26, minval=1)
laggingSpan2Periods = input.int(52, minval=1)
displacement = input.int(26, minval=1)
Tenkan = middleDonchian(conversionPeriods)
Kijun = middleDonchian(basePeriods)
xChikou = close
SenkouA = middleDonchian(laggingSpan2Periods)
SenkouB = (Tenkan[basePeriods] + Kijun[basePeriods]) / 2
//Plot
A = plot(SenkouA[displacement], color=color.new(colorpurple, 0), title='SenkouA')
B = plot(SenkouB, color=color.new(colorgreen, 0), title='SenkouB')
plot(switch1 ? xChikou : na, color=color.new(colorpink, 0), title='Chikou', offset=-displacement)
plot(switch2 ? Tenkan : na, color=color.new(colorred, 0), title='Tenkan')
plot(switch3 ? Kijun : na, color=color.new(colorblue, 0), title='Kijun')
fill(A, B, color=color.new(colorgreen, 90), title='Ichimoku Cloud')
//Buy and Sell signals
fukuiz = math.avg(ema2, ema8)
white = ema2 > ema8
gray = ema2 < ema8
buycond = white and white[1] == 0
sellcond = gray and gray[1] == 0
bullish = ta.barssince(buycond) < ta.barssince(sellcond)
bearish = ta.barssince(sellcond) < ta.barssince(buycond)
buy = bearish[1] and buycond and fukuiz > SenkouA[displacement] and fukuiz > SenkouB
sell = bullish[1] and sellcond and fukuiz > SenkouA[displacement] and fukuiz > SenkouB
sell2=ema2 < ema8
buy2 = white and fukuiz > SenkouA[displacement] and fukuiz > SenkouB
//$$$$$$$$$$$$$$$$$$$$$$$$$$$$$$$$$$$$$$$$$$$$$$$$$$$$$$$$$$$$$$$$$$$$$$
//Back test
startYear = input.int(defval=2017, title='Start Year', minval=2000, maxval=3000)
startMonth = input.int(defval=1, title='Start Month', minval=1, maxval=12)
startDay = input.int(defval=1, title='Start Day', minval=1, maxval=31)
endYear = input.int(defval=2023, title='End Year', minval=2000 ,maxval=3000)
endMonth = input.int(defval=12, title='End Month', minval=1, maxval=12)
endDay = input.int(defval=31, title='End Day', minval=1, maxval=31)
start = timestamp(startYear, startMonth, startDay, 00, 00)
end = timestamp(endYear, endMonth, endDay, 23, 59)
period() => time >= start and time <= end ? true : false
if buy2
strategy.entry(id='long', direction=strategy.long, when=period(), comment='BUY')
if sell2
strategy.close(id='long', when=period(), comment='SELL')