EMA Strategy with ATR Stop Loss

Overview
This strategy uses the EMA golden cross to generate trading signals, that is, a buy signal is generated when the fast EMA line crosses above the slow EMA line, and a sell signal is generated when the fast EMA line crosses below the slow EMA line. It belongs to a typical trend following strategy. At the same time, the strategy uses the ATR indicator to set a dynamic stop loss to control risks while ensuring profits.
Strategy Principle
- Define the fast EMA period as 13 and the slow EMA period as 48.
- When the fast EMA line crosses above the slow EMA line, a buy signal is generated; when the fast EMA line crosses below the slow EMA line, a sell signal is generated.
- Use the ta.crossover and ta.crossunder functions to determine golden cross and death cross of moving averages.
- Use the ATR indicator to calculate the dynamic stop loss, which is 1.5 times the ATR away from the close.
- Intuitively display trading signals and stop loss levels through color changes, buy/sell marks and stop loss lines.
Advantage Analysis
- Signals are generated based on EMA golden cross and death cross, which avoids missing major market trends and returns are considerable.
- ATR trailing stop loss ensures adequate trend-following profits while controlling drawdowns, achieving a balanced risk-reward ratio.
- Intuitive signal display and stop loss display, easy to operate, suitable for most people.
- Few adjustable parameters, easy to grasp and optimize.
Risk Analysis
- Flash crashes may trigger the stop loss.
- Frequent invalid signals may occur in ranging markets.
- Improper parameter settings may result in overly aggressive entry or loose stop loss.
- EMA parameters and ATR parameters need proper optimization.
Solutions:
- Appropriately loosen the ATR multiplier to leave some buffer from recent highs.
- Consider confirmation mechanisms after signal occurs, such as price breaking previous high etc.
- Parameter optimization should take into account various market conditions.
Optimization Directions
- Test different parameter combinations to find optimum parameters.
- Consider adding other indicators for signal filtering, such as volume, volatility indicators etc to improve signal quality.
- Adjust EMA parameters according to major trends to better capture main trends.
- Consider dynamically adjusting ATR stop loss multiplier to expand stop range during trending markets.
- Incorporate machine learning algorithms for adaptive parameter optimization.
Conclusion
The strategy is relatively simple and easy to use. It generates signals based on EMA crossovers, follows the trend, and uses ATR trailing stop loss to effectively control risks. Although there may be some false signals, it has strong capabilities in capturing main trends and returns are relatively stable. It is suitable as a basic quantitative trading strategy. There is also great potential for improvements through parameter optimization and function extensions.
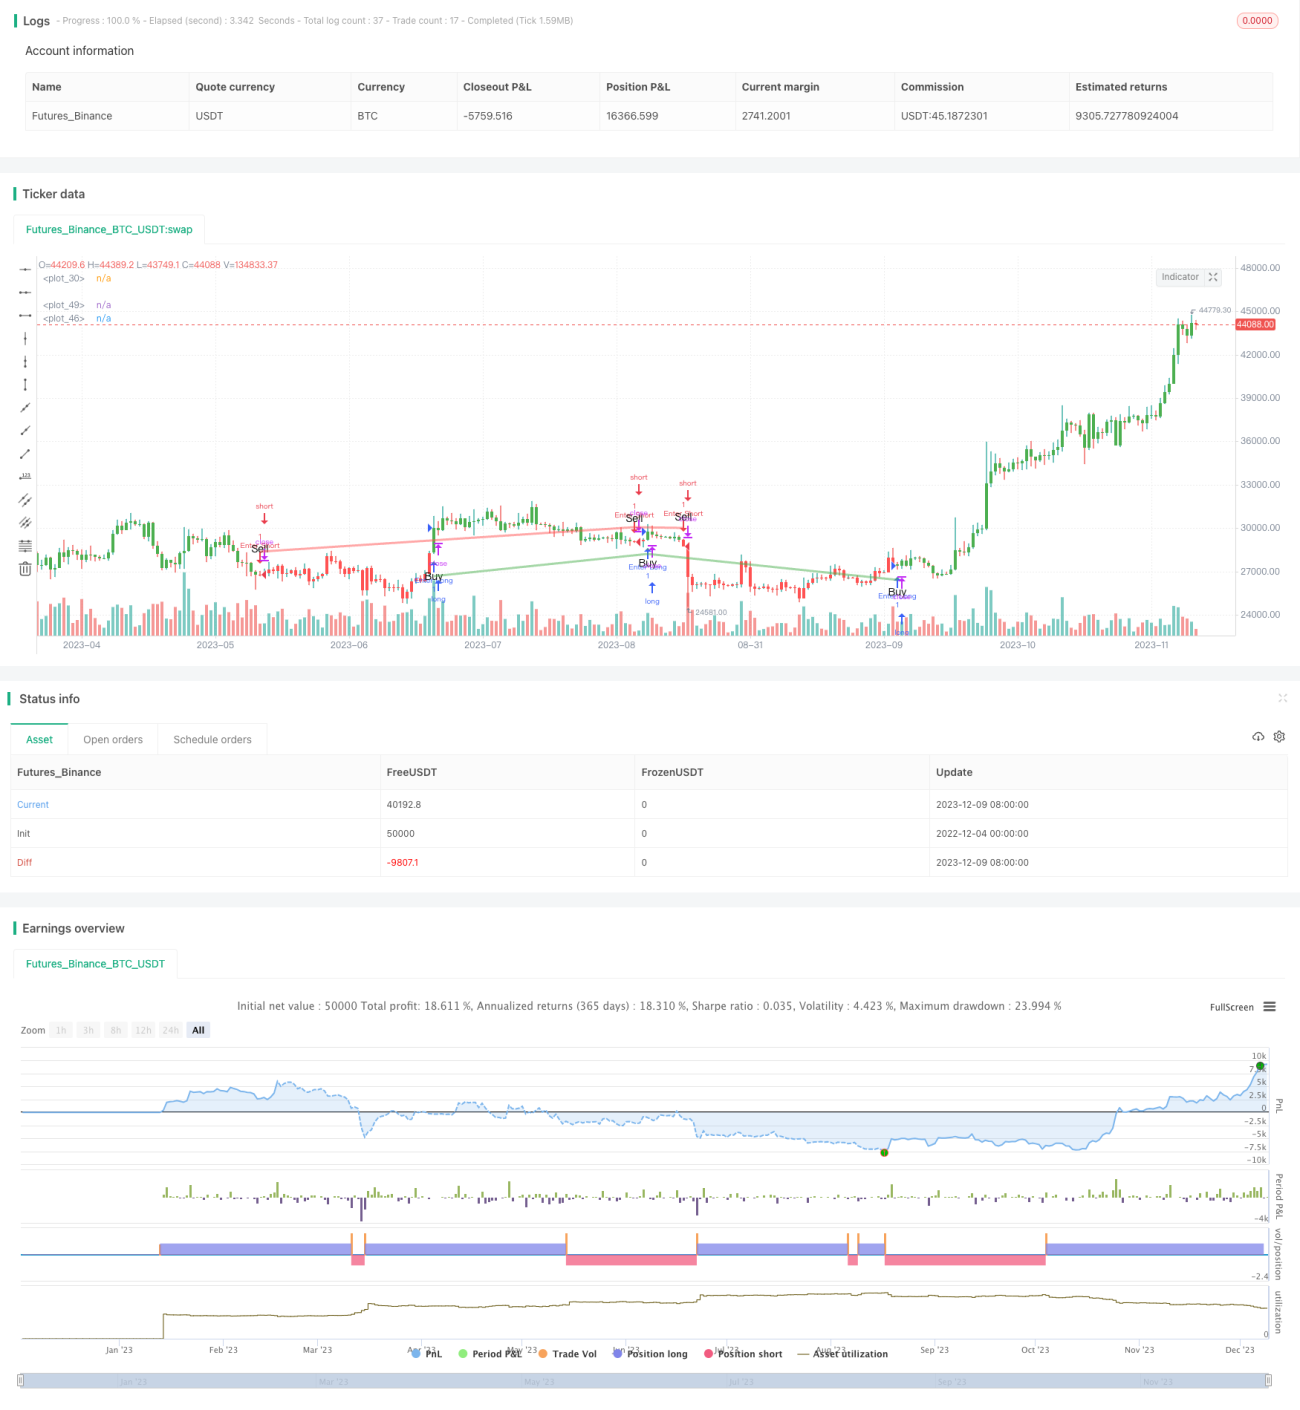
/*backtest
start: 2022-12-04 00:00:00
end: 2023-12-10 00:00:00
period: 1d
basePeriod: 1h
exchanges: [{"eid":"Futures_Binance","currency":"BTC_USDT"}]
*/

// This source code is subject to the terms of the Mozilla Public License 2.0 at https://mozilla.org/MPL/2.0/
// © byee322

/// This strategy uses the EMA to generate buy and sell signals with a 1.5x ATR stop loss- 1