Overview
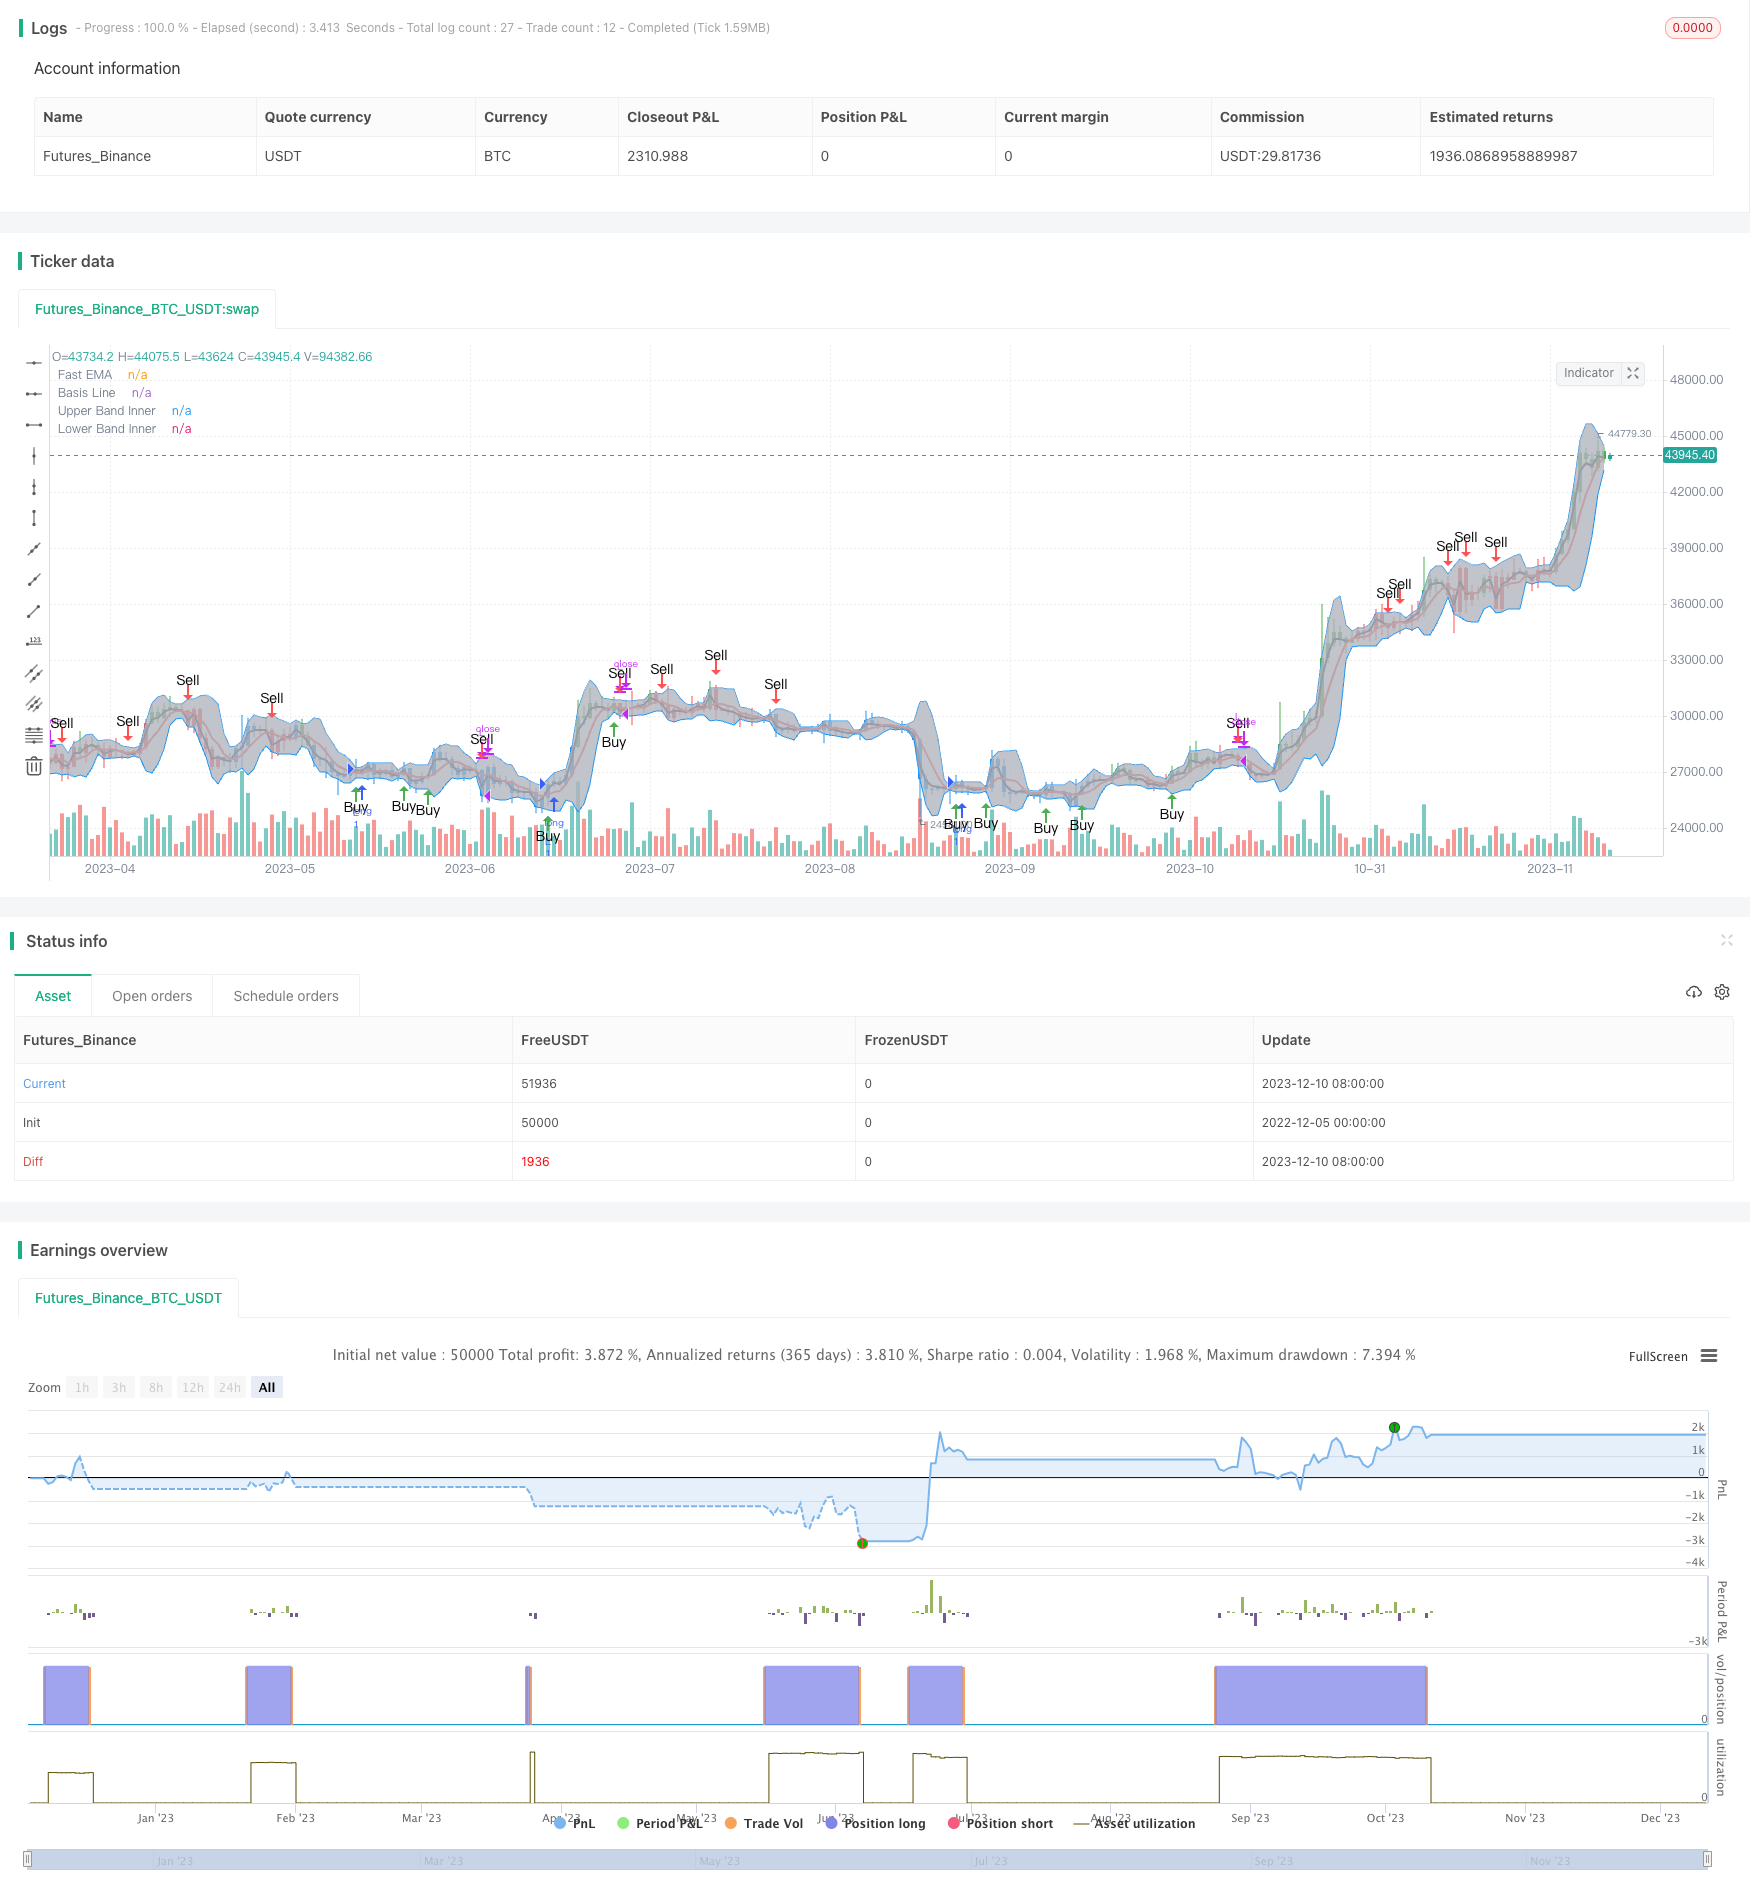
This strategy combines the Bollinger Bands indicator and the Awesome Oscillator (AO) indicator to implement a breakout trading model. It generates buy and sell signals when the fast EMA breaks through the BB channel, together with the AO indicator’s directional signals.
Strategy Logic
- Use the middle, upper and lower bands of Bollinger Bands to determine the price channel.
- Judge a channel breakout when fast EMA crosses the middle band.
- AO indicator determines the direction of uptrend or downtrend.
- When fast EMA breaks through middle band upward and AO is positive, a buy signal is generated.
- When fast EMA breaks through middle band downward and AO is negative, a sell signal is generated.
Advantage Analysis
- BB channel avoids wrong signals.
- AO indicator improves accuracy of signals.
- Captures greater profit at the beginning of a trend.
Risk Analysis
- Improper BB parameters may cause too wide or too narrow channel.
- AO parameters affect the accuracy.
- Breakout signal may be false breakout.
Solutions
- Optimize parameters of BB and AO to find best combination.
- Add strength condition to avoid false breakout.
- Combine with other indicators to ensure reliability.
Optimization Directions
- Optimize BB parameters to find suitable channel range.
- Optimize long and short term periods of AO to improve accuracy.
- Add volume or other filters to ensure breakout reliability.
- Optimize strength condition to lower false breakout rate.
Conclusion
This strategy comprehensively considers the price channel, trend direction and breakout model. It can be more robust and profitable through parameter optimization and indicator combinations. Its breakout model captures early trend opportunities and is very practical.
Strategy source code
/*backtest
start: 2022-12-05 00:00:00
end: 2023-12-11 00:00:00
period: 1d
basePeriod: 1h
exchanges: [{"eid":"Futures_Binance","currency":"BTC_USDT"}]
*/

//@version=3

strategy(shorttitle="BB+AO STRAT", title="BB+AO STRAT", overlay=true)


// === BACKTEST RANGE ===
FromMonth = input(defval = 6, title = "From Month", minval = 1)
FromDay   = input(defval = 1, title = "From Day", minval = 1)
FromYear  = input(defval = 2018, title = "From Year", minval = 2014)
ToMonth   = input(defval = 1, title = "To Month", minval = 1)
ToDay     = input(defval = 1, title = "To Day", minval = 1)
ToYear    = input(defval = 9999, title = "To Year", minval = 2014)

// Bollinger Bands Inputs
bb_use_ema = input(false, title="Use EMA for Bollinger Band")
bb_length = input(5, minval=1, title="Bollinger Length")
bb_source = input(close, title="Bollinger Source")
bb_mult = input(2.0, title="Base Multiplier", minval=0.5, maxval=10)
// EMA inputs
fast_ma_len = input(2, title="Fast EMA length", minval=2)
// Awesome Inputs
nLengthSlow = input(34, minval=1, title="Awesome Length Slow")
nLengthFast = input(5, minval=1, title="Awesome Length Fast")


// Breakout Indicator Inputs
bb_basis = bb_use_ema ? ema(bb_source, bb_length) : sma(bb_source, bb_length)
fast_ma  = ema(bb_source, fast_ma_len)

// Deviation

dev = stdev(bb_source, bb_length)
bb_dev_inner = bb_mult * dev

// Upper bands
inner_high = bb_basis + bb_dev_inner
// Lower Bands
inner_low = bb_basis - bb_dev_inner

// Calculate Awesome Oscillator
xSMA1_hl2 = sma(hl2, nLengthFast)
xSMA2_hl2 = sma(hl2, nLengthSlow)
xSMA1_SMA2 = xSMA1_hl2 - xSMA2_hl2
// Calculate direction of AO
AO = xSMA1_SMA2>=0? xSMA1_SMA2 > xSMA1_SMA2[1] ? 1 : 2 : xSMA1_SMA2 > xSMA1_SMA2[1] ? -1 : -2


// === PLOTTING ===

// plot BB basis
plot(bb_basis, title="Basis Line", color=red, transp=10, linewidth=2)
// plot BB upper and lower bands
ubi = plot(inner_high, title="Upper Band Inner", color=blue, transp=10, linewidth=1)
lbi = plot(inner_low, title="Lower Band Inner", color=blue, transp=10, linewidth=1)
// center BB channel fill
fill(ubi, lbi, title="Center Channel Fill", color=silver, transp=90)

// plot fast ma
plot(fast_ma, title="Fast EMA", color=black, transp=10, linewidth=2)

// Calc breakouts
break_down =   crossunder(fast_ma, bb_basis) and close < bb_basis and abs(AO)==2
break_up   =  crossover(fast_ma, bb_basis) and close > bb_basis and abs(AO)==1

// Show Break Alerts
plotshape(break_down, title="Breakout Down", style=shape.arrowdown, location=location.abovebar, size=size.auto, text="Sell", color=red, transp=0)
plotshape(break_up, title="Breakout Up", style=shape.arrowup, location=location.belowbar, size=size.auto, text="Buy", color=green, transp=0)
// === ALERTS ===


strategy.entry("L", strategy.long, when=(break_up and (time > timestamp(FromYear, FromMonth, FromDay, 00, 00)) and (time < timestamp(ToYear, ToMonth, ToDay, 23, 59))))


strategy.close("L", when=(break_down and (time < timestamp(ToYear, ToMonth, ToDay, 23, 59))))

// === /PLOTTING ===
barcolor(AO == 2 ? red: AO == 1 ? green : blue )


// eof