
The open close cross point strategy is a quantitative trading strategy based on moving average crossovers. It determines price trends by calculating crosses between fast and slow moving average lines and generates buy and sell signals at crossover points. This strategy uses Hull Moving Average as the fast line and Super Smoother filter as the slow line. This combination incorporates both the smoothness and trend determination ability of moving averages and can effectively identify price movements to produce relatively reliable trading signals.
The formulas for calculating the open close cross point strategy are: Fast line (Hull MA): WMA(2 * WMA(price, n/2) - WMA(price, n), SQRT(n)) Slow line (Super Smoother Filter): Price triple filter
Where WMA is the Weighted Moving Average, SQRT is the square root, and the filter contains one first order lag term and two second order lag terms.
The strategy judges the relationship between the fast and slow lines by calculating their values. Where:
Upward crossover of fast line is buy signal
Downward crossover of fast line is sell signal
The open close cross point strategy combines the advantages of dual moving average judgments and point trading. It can accurately capture trend turning points for timely entries and exits. Compared to single moving average strategies, it has the following advantages:
The open close cross point strategy also carries certain risks:
The open close cross point strategy can be optimized in the following dimensions:
The open close cross point strategy inherits the advantages of moving average strategies while expanding the use of dual moving average judgments and point trading models to form a more advanced and reliable quantitative trading scheme. It has unique advantages in timing trading which deserve live testing and application exploration. This article thoroughly parses the principles, strengths and weaknesses of this strategy, and provides optimization ideas for reference. It is believed that with continuous improvements on the model and parameters, this strategy will become a formidable market timing tool.
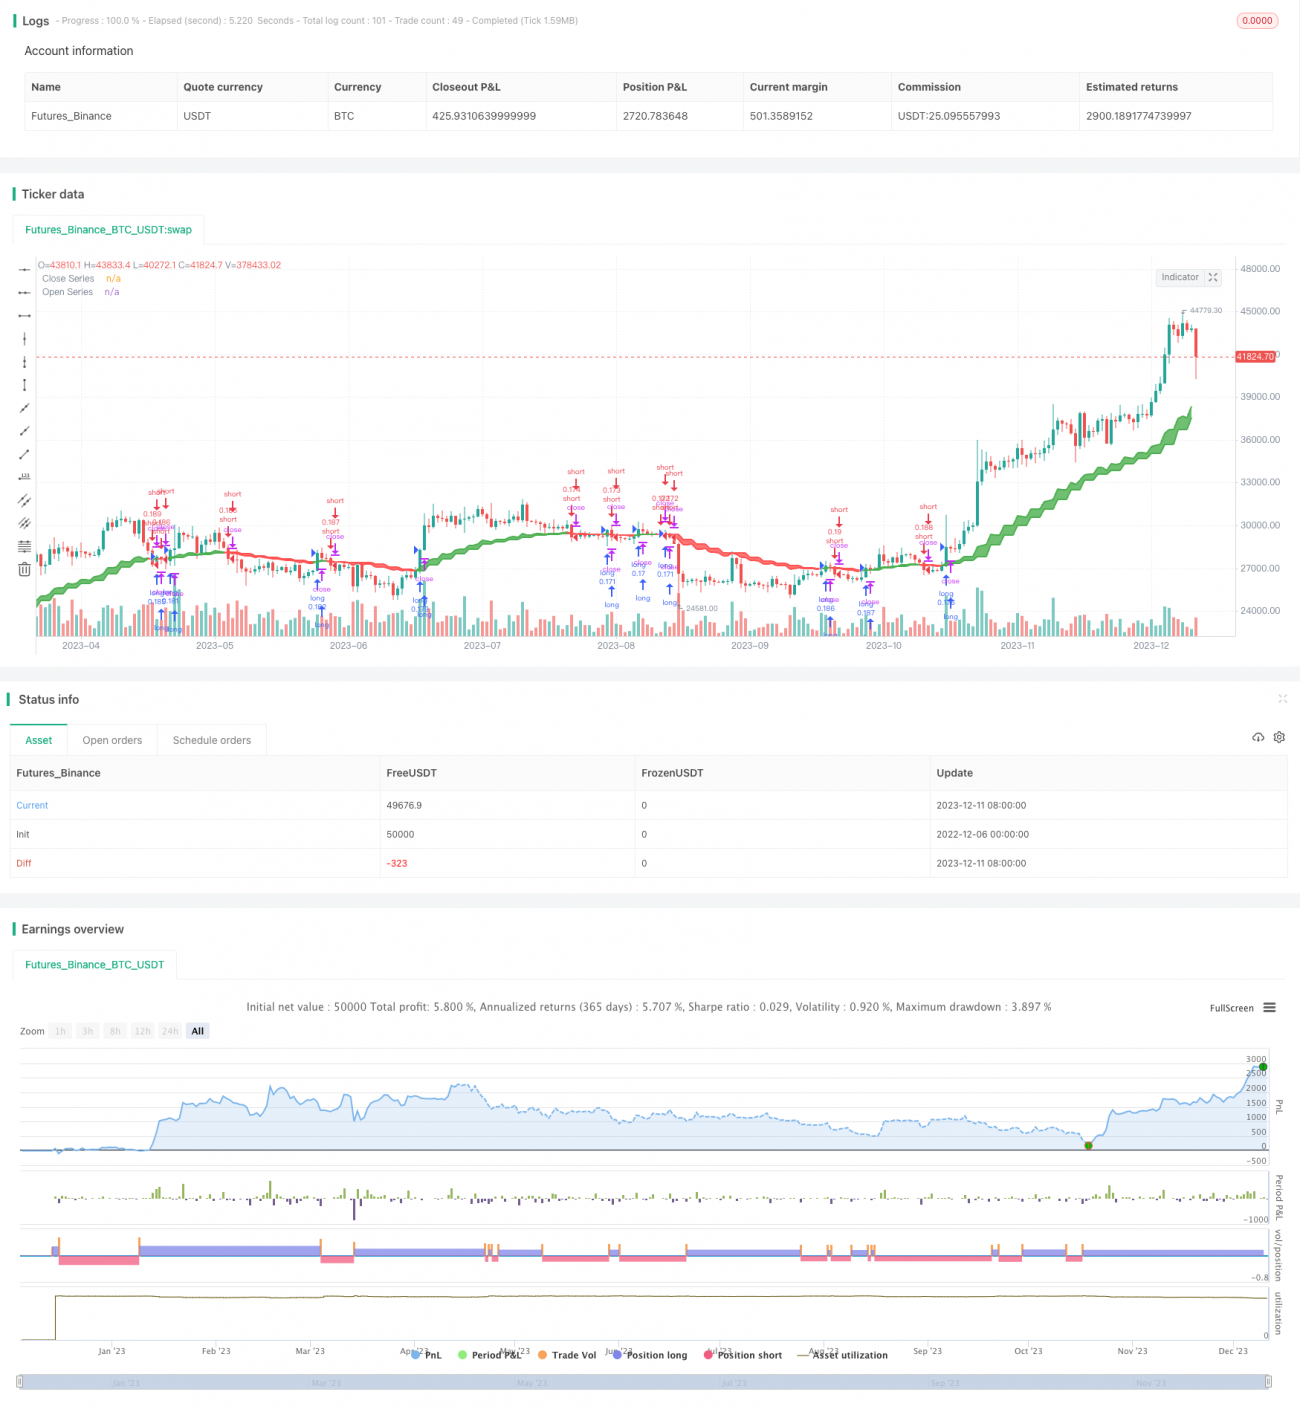
/*backtest
start: 2022-12-06 00:00:00
end: 2023-12-12 00:00:00
period: 1d
basePeriod: 1h
exchanges: [{"eid":"Futures_Binance","currency":"BTC_USDT"}]
*/
//@version=5
//
strategy(title='Open Close Cross Strategy ', shorttitle='sacinvesting', overlay=true, pyramiding=0, default_qty_type=strategy.percent_of_equity, default_qty_value=10, calc_on_every_tick=false)
// === INPUTS ===
useRes = input(defval=true, title='Use Alternate Resolution?')
intRes = input(defval=3, title='Multiplier for Alernate Resolution')
stratRes = timeframe.ismonthly ? str.tostring(timeframe.multiplier * intRes, '###M') : timeframe.isweekly ? str.tostring(timeframe.multiplier * intRes, '###W') : timeframe.isdaily ? str.tostring(timeframe.multiplier * intRes, '###D') : timeframe.isintraday ? str.tostring(timeframe.multiplier * intRes, '####') : '60'
basisType = input.string(defval='SMMA', title='MA Type: ', options=['SMA', 'EMA', 'DEMA', 'TEMA', 'WMA', 'VWMA', 'SMMA', 'HullMA', 'LSMA', 'ALMA', 'SSMA', 'TMA'])
basisLen = input.int(defval=8, title='MA Period', minval=1)
offsetSigma = input.int(defval=6, title='Offset for LSMA / Sigma for ALMA', minval=0)
offsetALMA = input.float(defval=0.85, title='Offset for ALMA', minval=0, step=0.01)
scolor = input(false, title='Show coloured Bars to indicate Trend?')
delayOffset = input.int(defval=0, title='Delay Open/Close MA (Forces Non-Repainting)', minval=0, step=1)
tradeType = input.string('BOTH', title='What trades should be taken : ', options=['LONG', 'SHORT', 'BOTH', 'NONE'])
// === /INPUTS ===
// Constants colours that include fully non-transparent option.
green100 = #008000FF
lime100 = #00FF00FF
red100 = #FF0000FF
blue100 = #0000FFFF
aqua100 = #00FFFFFF
darkred100 = #8B0000FF
gray100 = #808080FF
// === BASE FUNCTIONS ===
// Returns MA input selection variant, default to SMA if blank or typo.
variant(type, src, len, offSig, offALMA) =>
v1 = ta.sma(src, len) // Simple
v2 = ta.ema(src, len) // Exponential
v3 = 2 * v2 - ta.ema(v2, len) // Double Exponential
v4 = 3 * (v2 - ta.ema(v2, len)) + ta.ema(ta.ema(v2, len), len) // Triple Exponential
v5 = ta.wma(src, len) // Weighted
v6 = ta.vwma(src, len) // Volume Weighted
v7 = 0.0
sma_1 = ta.sma(src, len) // Smoothed
v7 := na(v7[1]) ? sma_1 : (v7[1] * (len - 1) + src) / len
v8 = ta.wma(2 * ta.wma(src, len / 2) - ta.wma(src, len), math.round(math.sqrt(len))) // Hull
v9 = ta.linreg(src, len, offSig) // Least Squares
v10 = ta.alma(src, len, offALMA, offSig) // Arnaud Legoux
v11 = ta.sma(v1, len) // Triangular (extreme smooth)
// SuperSmoother filter
// ©️ 2013 John F. Ehlers
a1 = math.exp(-1.414 * 3.14159 / len)
b1 = 2 * a1 * math.cos(1.414 * 3.14159 / len)
c2 = b1
c3 = -a1 * a1
c1 = 1 - c2 - c3
v12 = 0.0
v12 := c1 * (src + nz(src[1])) / 2 + c2 * nz(v12[1]) + c3 * nz(v12[2])
type == 'EMA' ? v2 : type == 'DEMA' ? v3 : type == 'TEMA' ? v4 : type == 'WMA' ? v5 : type == 'VWMA' ? v6 : type == 'SMMA' ? v7 : type == 'HullMA' ? v8 : type == 'LSMA' ? v9 : type == 'ALMA' ? v10 : type == 'TMA' ? v11 : type == 'SSMA' ? v12 : v1
// security wrapper for repeat calls
reso(exp, use, res) =>
security_1 = request.security(syminfo.tickerid, res, exp, gaps=barmerge.gaps_off, lookahead=barmerge.lookahead_on)
use ? security_1 : exp
// === /BASE FUNCTIONS ===
// === SERIES SETUP ===
closeSeries = variant(basisType, close[delayOffset], basisLen, offsetSigma, offsetALMA)
openSeries = variant(basisType, open[delayOffset], basisLen, offsetSigma, offsetALMA)
// === /SERIES ===
// === PLOTTING ===
// Get Alternate resolution Series if selected.
closeSeriesAlt = reso(closeSeries, useRes, stratRes)
openSeriesAlt = reso(openSeries, useRes, stratRes)
//
trendColour = closeSeriesAlt > openSeriesAlt ? color.green : color.red
bcolour = closeSeries > openSeriesAlt ? lime100 : red100
barcolor(scolor ? bcolour : na, title='Bar Colours')
closeP = plot(closeSeriesAlt, title='Close Series', color=trendColour, linewidth=2, style=plot.style_line, transp=20)
openP = plot(openSeriesAlt, title='Open Series', color=trendColour, linewidth=2, style=plot.style_line, transp=20)
fill(closeP, openP, color=trendColour, transp=80)
// === /PLOTTING ===
//
//
// === ALERT conditions
xlong = ta.crossover(closeSeriesAlt, openSeriesAlt)
xshort = ta.crossunder(closeSeriesAlt, openSeriesAlt)
longCond = xlong // alternative: longCond[1]? false : (xlong or xlong[1]) and close>closeSeriesAlt and close>=open
shortCond = xshort // alternative: shortCond[1]? false : (xshort or xshort[1]) and close<closeSeriesAlt and close<=open
// === /ALERT conditions.
// === STRATEGY ===
// stop loss
slPoints = input.int(defval=0, title='Initial Stop Loss Points (zero to disable)', minval=0)
tpPoints = input.int(defval=0, title='Initial Target Profit Points (zero for disable)', minval=0)
// Include bar limiting algorithm
ebar = input.int(defval=10000, title='Number of Bars for Back Testing', minval=0)
dummy = input(false, title='- SET to ZERO for Daily or Longer Timeframes')
//
// Calculate how many mars since last bar
tdays = (timenow - time) / 60000.0 // number of minutes since last bar
tdays := timeframe.ismonthly ? tdays / 1440.0 / 5.0 / 4.3 / timeframe.multiplier : timeframe.isweekly ? tdays / 1440.0 / 5.0 / timeframe.multiplier : timeframe.isdaily ? tdays / 1440.0 / timeframe.multiplier : tdays / timeframe.multiplier // number of bars since last bar
//
//set up exit parameters
TP = tpPoints > 0 ? tpPoints : na
SL = slPoints > 0 ? slPoints : na
// Make sure we are within the bar range, Set up entries and exit conditions
if (ebar == 0 or tdays <= ebar) and tradeType != 'NONE'
strategy.entry('long', strategy.long, when=longCond == true and tradeType != 'SHORT')
strategy.entry('short', strategy.short, when=shortCond == true and tradeType != 'LONG')
strategy.close('long', when=shortCond == true and tradeType == 'LONG')
strategy.close('short', when=longCond == true and tradeType == 'SHORT')
strategy.exit('XL', from_entry='long', profit=TP, loss=SL)
strategy.exit('XS', from_entry='short', profit=TP, loss=SL)
// === /STRATEGY ===
// eof