MACD Dual Moving Average Tracking Strategy

1
Follow
1779
Followers
Overview
This strategy is named MACD Dual Moving Average Tracking Strategy. It uses MACD indicator’s golden cross and death cross of dual moving averages as trading signals, combined with the previous day’s lowest price as the stop loss point to track the short-term price movement.
Strategy Logic
- Calculate fast EMA(close,5), slow EMA(close,8) and signal SMA(MACD,3)
- Define long signal: when fast MA crosses above slow MA
- Define short signal: when fast MA crosses below slow MA or closing price is lower than previous day’s lowest price
- Position size is initial capital 2000 USD divided by closing price
- Use short signal to close long position as stop loss
Advantage Analysis
- Use MACD indicator to determine overbought and oversold zones, with dual MAs to form trading signals, avoiding false breakout
- Track short-term trends, timely stop loss
- Dynamic adjustment of position size avoids excessively large single loss
Risk Analysis
- MACD indicator has lagging effect, may miss short-term opportunities
- Dual MA trading signals may produce false signals
- Stop loss point is too aggressive, with high frequency of being stopped out
Optimization Directions
- Optimize MACD parameters combination to improve indicator sensitivity
- Add trend judgment to avoid false signals from market consolidation
- Combine with Volatility Index to assess market volatility, adjust stop loss point
Summary
This strategy uses the classic MACD dual moving average combination indicator to determine overbought and oversold zones, generating trading signals, while introducing dynamic position sizing and previous day’s lowest price as stop loss point design to capture short-term price fluctuations. The overall strategy logic is clear and easy to understand, worth further testing and optimization.
Source
Pine
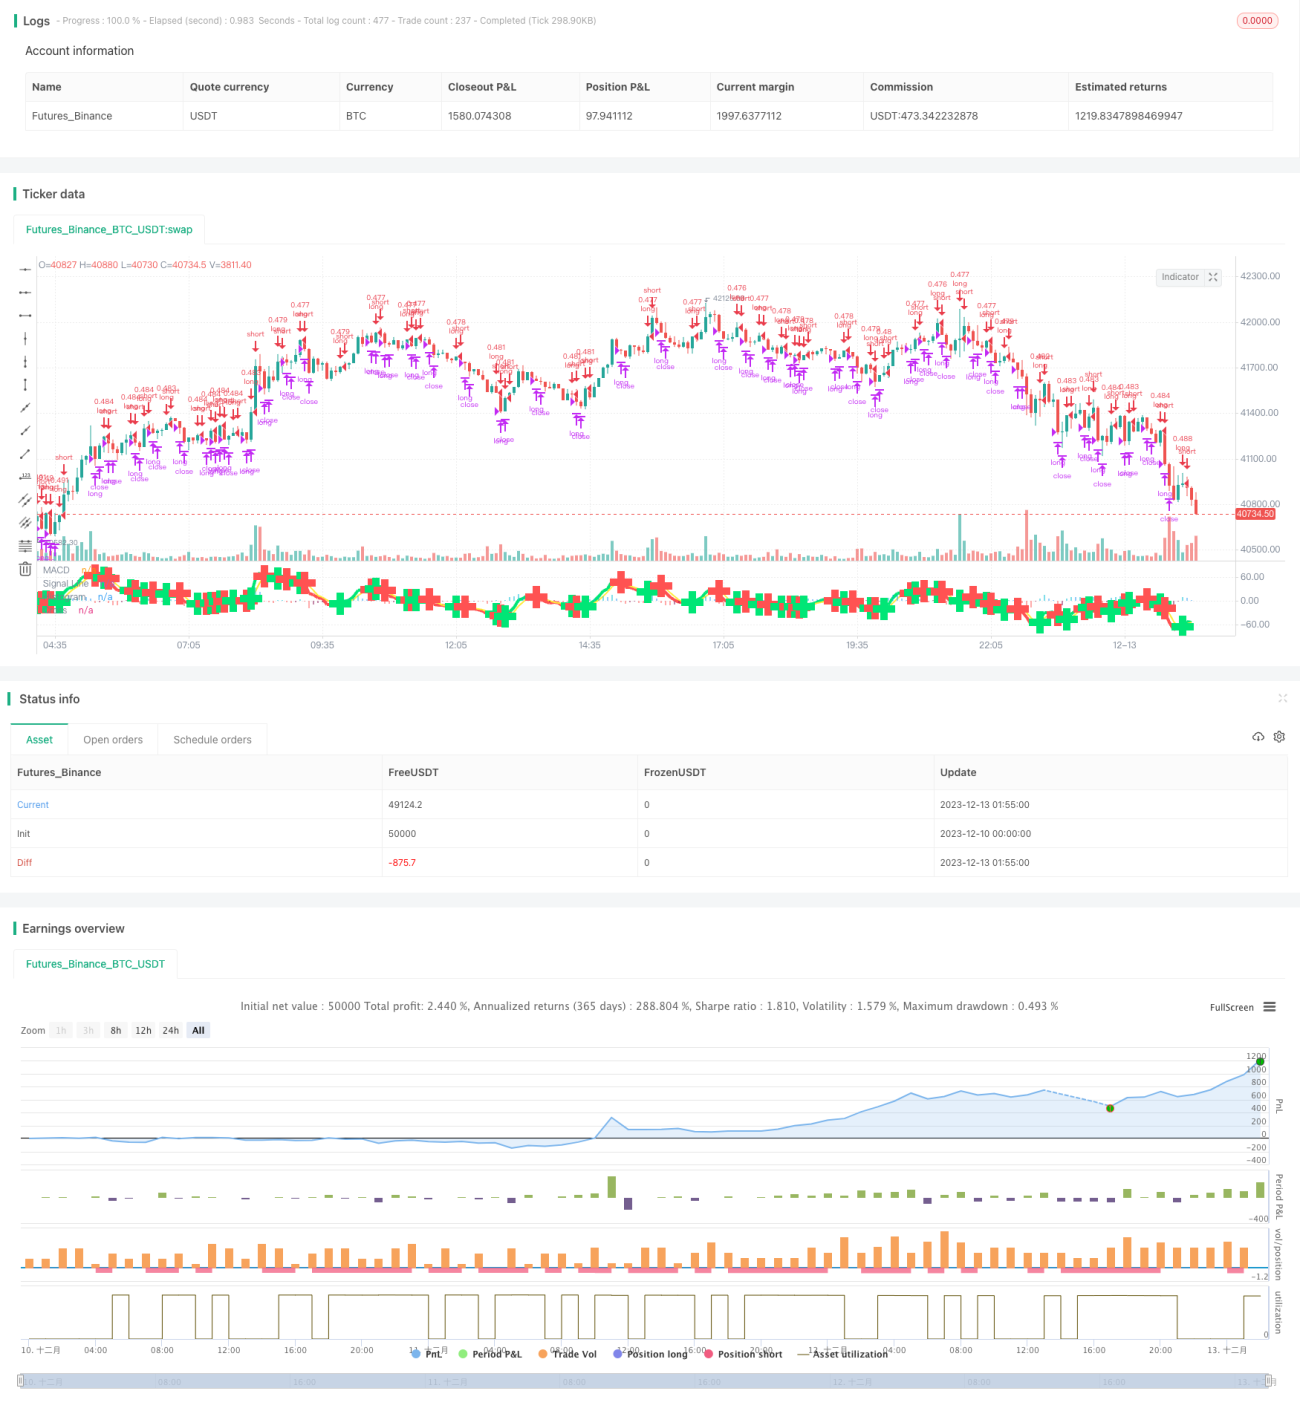
/*backtest
start: 2023-12-10 00:00:00
end: 2023-12-13 02:00:00
period: 5m
basePeriod: 1m
exchanges: [{"eid":"Futures_Binance","currency":"BTC_USDT"}]
*/

//@version=2
// macd/cam v1 strategizing Chris Moody Macd indicator https://www.tradingview.com/script/OQx7vju0-MacD-Custom-Indicator-Multiple-Time-Frame-All-Available-Options/
// macd/cam v2 changing to macd 5,8,3
// macd/cam v2.1 Strategy parameters
Related strategies
Comment
All comments (0)
No data
- 1