
This strategy opens and closes positions based on the Super Trend indicator and trailing stop loss. It uses 4 alerts to open and close long and short positions, and adopts a super trend strategy. The strategy is designed specifically for robots with trailing stop loss functionality.
The strategy uses the ATR indicator to calculate the upper and lower bands. A buy signal is generated when the closing price breaks through the upper band, and a sell signal is generated when it breaks through the lower band. The strategy also uses a super trend line to determine the trend direction. When the super trend line goes up, it indicates the start of a bull market. When it goes down, it indicates the start of a bear market. The strategy opens positions when a signal is generated, and sets the initial stop loss price. It then adjusts the stop loss price based on price changes to lock in profits and achieve a trailing stop loss effect.
The strategy combines the advantages of the Super Trend indicator for determining trend direction and the ATR indicator for setting stops. It can effectively filter out false breakouts. Trailing stops can lock in profits very well and reduce drawdowns. In addition, the strategy is designed specifically for robots, enabling automated trading.
The Super Trend indicator can easily generate more false signals. When the stop loss adjustment range is large, the probability of stop loss being hit increases. In addition, robot trading also faces technical risks such as server crashes and network interruptions.
To reduce the probability of false signals, the ATR parameters can be adjusted appropriately or other indicators can be added for filtration. When adjusting the trailing stop range, profit and risk need to be balanced. At the same time, prepare backup servers and networks to hedge against technical failure risks.
The following are some directions in which this strategy can be optimized:
Add indicators or conditions to filter entry signals and avoid false signals. For example, the MACD indicator can be added.
Test different ATR parameter combinations to find the optimal parameters.
Optimize the trailing stop loss range to find the best balance point.
Add more stop loss prices to achieve batch stopping of losses.
Build a dual-server architecture with primary and standby servers that can quickly switch when the main server fails.
This strategy integrates the advantages of the Super Trend indicator and trailing stop loss for automated opening and stopping of losses. Combined with the improvement measures in the optimization directions during live trading, it can become a very practical quantitative trading strategy.
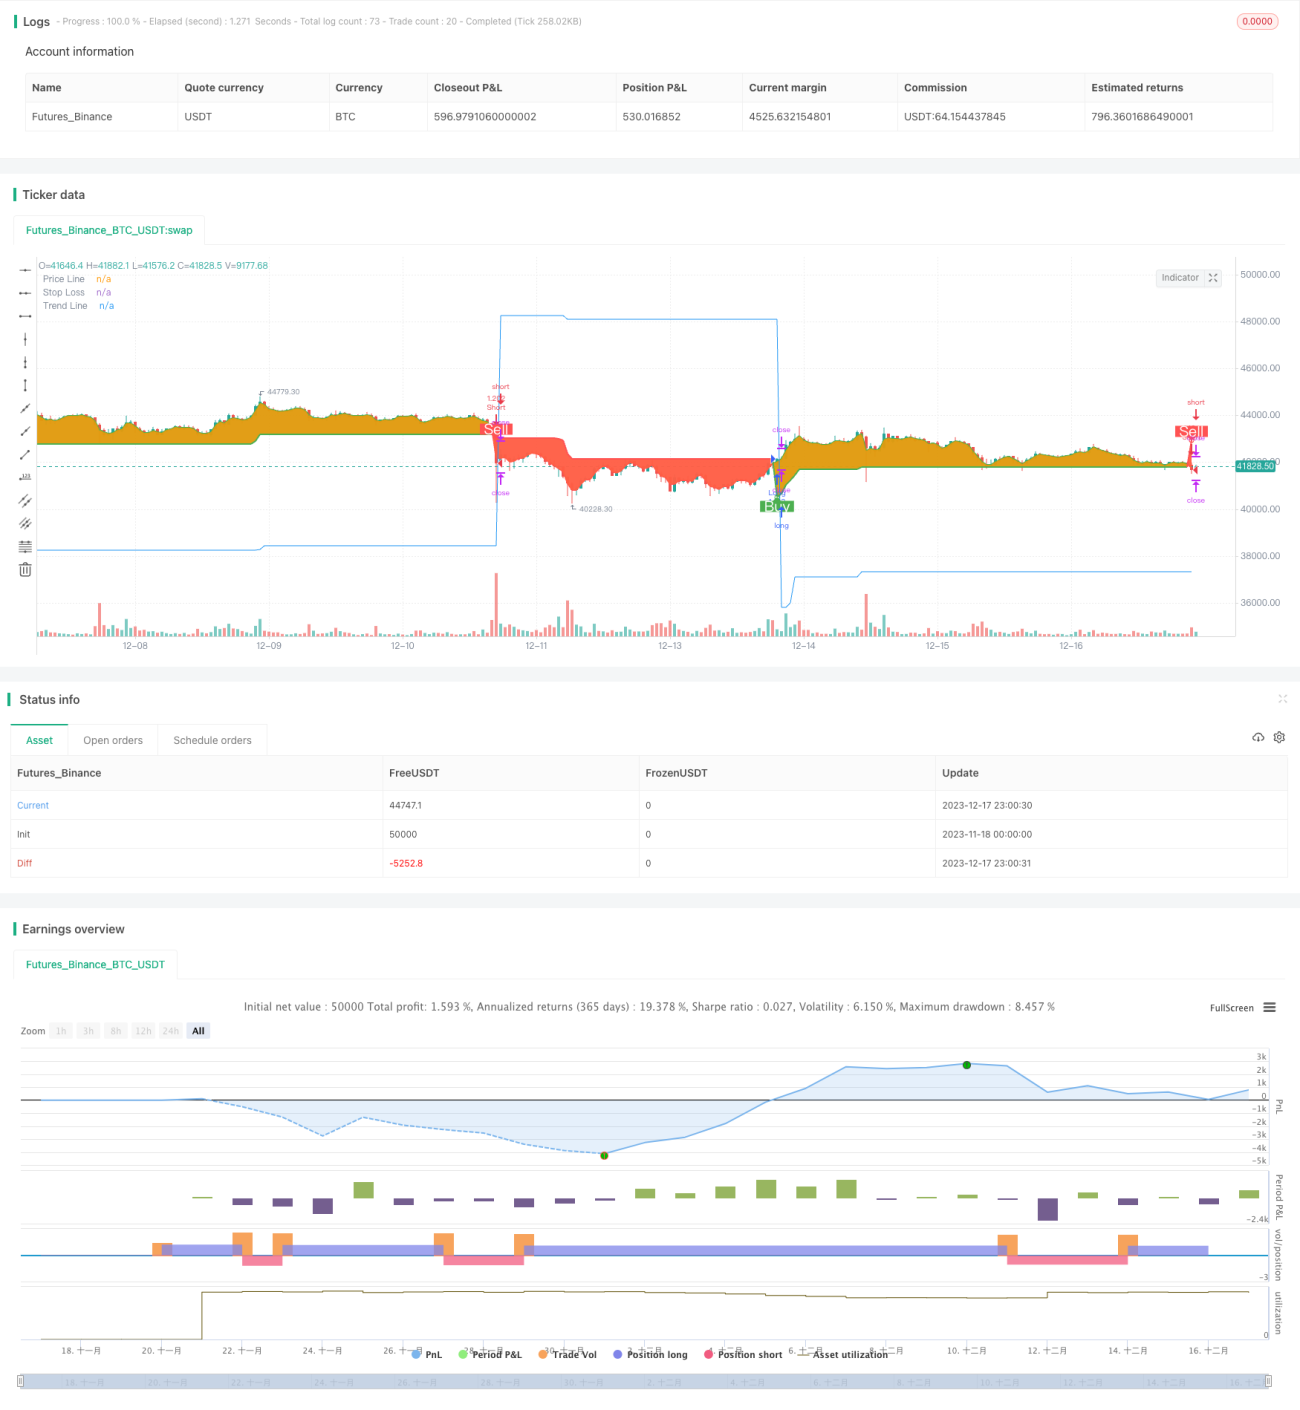
/*backtest
start: 2023-11-18 00:00:00
end: 2023-12-18 00:00:00
period: 1h
basePeriod: 15m
exchanges: [{"eid":"Futures_Binance","currency":"BTC_USDT"}]
*/
// This source code is subject to the terms of the Mozilla Public License 2.0 at https://mozilla.org/MPL/2.0/
// © arminomid1375
//@version=5
strategy('Mizar_BOT_super trend', overlay=true, default_qty_value=100, currency=currency.USD, default_qty_type=strategy.percent_of_equity, initial_capital=100, max_bars_back=4000)
//===== INPUTS ==========================================================================//
factor = input.float(4.5, title='ATR Factor', step=0.1,group = 'ATR')
period = input.int(59, minval=1, maxval=100, title='ATR Period',group = 'ATR')
up = (high + low) / 2 - factor * ta.atr(period)
down = (high + low) / 2 + factor * ta.atr(period)
trend_up = 0.0
trend_up := close[1] > trend_up[1] ? math.max(up, trend_up[1]) : up
trend_down = 0.0
trend_down := close[1] < trend_down[1] ? math.min(down, trend_down[1]) : down
trend = 0.0
trend := close > trend_down[1] ? 1 : close < trend_up[1] ? -1 : nz(trend[1], 1)
tsl = trend == 1 ? trend_up : trend_down
line_color = trend == 1 ? 'green' : 'red'
long_signal = trend == 1 and trend[1] == -1
short_signal = trend == -1 and trend[1] == 1
background = true
//ss = input.float(defval=15.0, minval=0.0, title=' stop loss %',group = 'stop loss')
use_sl = input(title='trailing stop ?', defval=true,group = 'stop loss')
initial_sl_pct = input.float(defval=15.0, minval=0.0, title='trailing stop %',group = 'stop loss')
Tpactive1 = input(title='Take profit1 On/Off ?', defval=true, group='take profit')
tp1percent = input.float(5.0, title='TP1 %', group='take profit') *100
tp1amt = input.int(10, title='TP1 Amount %', group='take profit')
Tpactive2 = input(title='Take profit2 On/Off ?', defval=true, group='take profit')
tp2percent = input.float(10, title='TP2 %', group='take profit') *100
tp2amt = input.int(15, title='TP2 Amount %', group='take profit')
Tpactive3 = input(title='Take profit3 On/Off ?', defval=true, group='take profit')
tp3percent = input.float(15, title='TP3 %', group='take profit')*100
tp3amt = input.int(20, title='TP3 Amount %', group='take profit')
//===== TIMEFRAME ==========================================================================//
from_month = input.int(defval=1, title='From Month', minval=1, maxval=12)
from_day = input.int(defval=1, title='From Day', minval=1, maxval=31)
from_year = input.int(defval=2019, title='From Year', minval=2017)
to_month = input.int(defval=1, title='To Month', minval=1, maxval=12)
to_day = input.int(defval=1, title='To Day', minval=1, maxval=31)
to_year = input.int(defval=9999, title='To Year', minval=2017)
start = timestamp(from_year, from_month, from_day, 00, 00)
finish = timestamp(to_year, to_month, to_day, 23, 59)
window() =>
time >= start and time <= finish ? true : false
//===== PLOTS ==========================================================================//
// Line
line_plot = plot(tsl, color=trend == 1 ? color.green : color.red, linewidth=2, title='Trend Line')
// Labels
plotshape(long_signal and window() ? up : na, title='Buy', text='Buy', location=location.absolute, style=shape.labelup, size=size.normal, color=color.new(color.green, 0), textcolor=color.new(color.white, 0))
plotshape(short_signal and window() ? down : na, title='Sell', text='Sell', location=location.absolute, style=shape.labeldown, size=size.normal, color=color.new(color.red, 0), textcolor=color.new(color.white, 0))
// Circles
plotshape(long_signal and window() ? up : na, title='Uptrend starts', location=location.absolute, style=shape.circle, size=size.tiny, color=color.new(color.green, 0))
plotshape(short_signal and window() ? down : na, title='Downtrend starts', location=location.absolute, style=shape.circle, size=size.tiny, color=color.new(color.red, 0))
// Background
long_fill = background ? trend == 1 ? color.green : na : na
short_fill = background ? trend == -1 ? color.red : na : na
candle_plot = plot(ohlc4, title='Price Line', color=trend == 1 ? long_fill : short_fill, linewidth=2, transp=90)
fill(candle_plot, line_plot, title='Long Background', color=long_fill, transp=90)
fill(candle_plot, line_plot, title='Short Background', color=short_fill, transp=90)
//===== GLOBAL ==========================================================================//
var entry_price = 0.0
var updated_entry_price = 0.0
var sl_price = 0.0
longString = "Input your custom alert message here.\nAnd put {{strategy.order.alert_message}} in the message box."
longclose = "Input your custom alert message here.\nAnd put {{strategy.order.alert_message}} in the message box."
shortString = "Input your custom alert message here.\nAnd put {{strategy.order.alert_message}} in the message box."
shortclose = "Input your custom alert message here.\nAnd put {{strategy.order.alert_message}} in the message box."
longAlertMessage = input(title="Long Alert Message", defval="long", group="Alert Messages", tooltip=longString)
longcloseAlertMessage = input(title="Long close Alert Message", defval="long", group="Alert Messages", tooltip=longclose)
shortAlertMessage = input(title="Short Alert Message", defval="short", group="Alert Messages", tooltip=shortString)
shortcloseAlertMessage = input(title="Short close Alert Message", defval="short", group="Alert Messages", tooltip=shortclose)
has_open_trade() =>
strategy.position_size != 0
has_no_open_trade() =>
strategy.position_size == 0
is_long() =>
strategy.position_size > 0 ? true : false
is_short() =>
strategy.position_size < 0 ? true : false
plot(use_sl ? has_no_open_trade() ? close : sl_price : na, color=has_no_open_trade() ? na : color.blue, title='Stop Loss')
strategy_close() =>
if is_long()
strategy.close('Long')
alert(longcloseAlertMessage)
if is_short()
strategy.close('Short')
alert(shortcloseAlertMessage)
strategy_long() =>
strategy.entry('Long', strategy.long)
strategy_short() =>
strategy.entry('Short', strategy.short)
sl_pct = initial_sl_pct
if long_signal or is_long() and not(short_signal or is_short())
sl_pct := initial_sl_pct * -1
sl_pct
//===== STRATEGY ==========================================================================//
crossed_sl = false
if is_long() and use_sl
crossed_sl := close <= sl_price
crossed_sl
if is_short() and use_sl
crossed_sl := close >= sl_price
crossed_sl
terminate_operation = window() and has_open_trade() and crossed_sl
if terminate_operation and not(long_signal or short_signal) // Do not close position if trend is flipping anyways.
entry_price := 0.0
updated_entry_price := entry_price
sl_price := 0.0
strategy_close()
start_operation = window() and (long_signal or short_signal)
if start_operation
entry_price := close
updated_entry_price := entry_price
sl_price := entry_price + entry_price * sl_pct / 100
if long_signal
strategy_long()
if Tpactive1==true
strategy.exit('TPL1','Long', qty_percent=tp1amt,profit =tp1percent)
alert(shortcloseAlertMessage)
alert(longAlertMessage)
if short_signal
strategy_short()
if Tpactive1==true
strategy.exit('TPL1','Short', qty_percent=tp1amt,profit =tp1percent)
alert(longcloseAlertMessage)
alert(shortAlertMessage)
//===== TRAILING ==========================================================================//
if is_long() and use_sl
strategy_pct = (close - updated_entry_price) / updated_entry_price * 100.00
if strategy_pct > 1
sl_pct += strategy_pct - 1.0
new_sl_price = updated_entry_price + updated_entry_price * sl_pct / 100
sl_price := math.max(sl_price, new_sl_price)
updated_entry_price := sl_price
updated_entry_price
if is_short() and use_sl
strategy_pct = (close - updated_entry_price) / updated_entry_price * 100.00
if strategy_pct < -1
sl_pct += strategy_pct + 1.0
new_sl_price = updated_entry_price + updated_entry_price * sl_pct / 100
sl_price := math.min(sl_price, new_sl_price)
updated_entry_price := sl_price
updated_entry_price