Ehlers Instantaneous Trendline Strategy

Overview
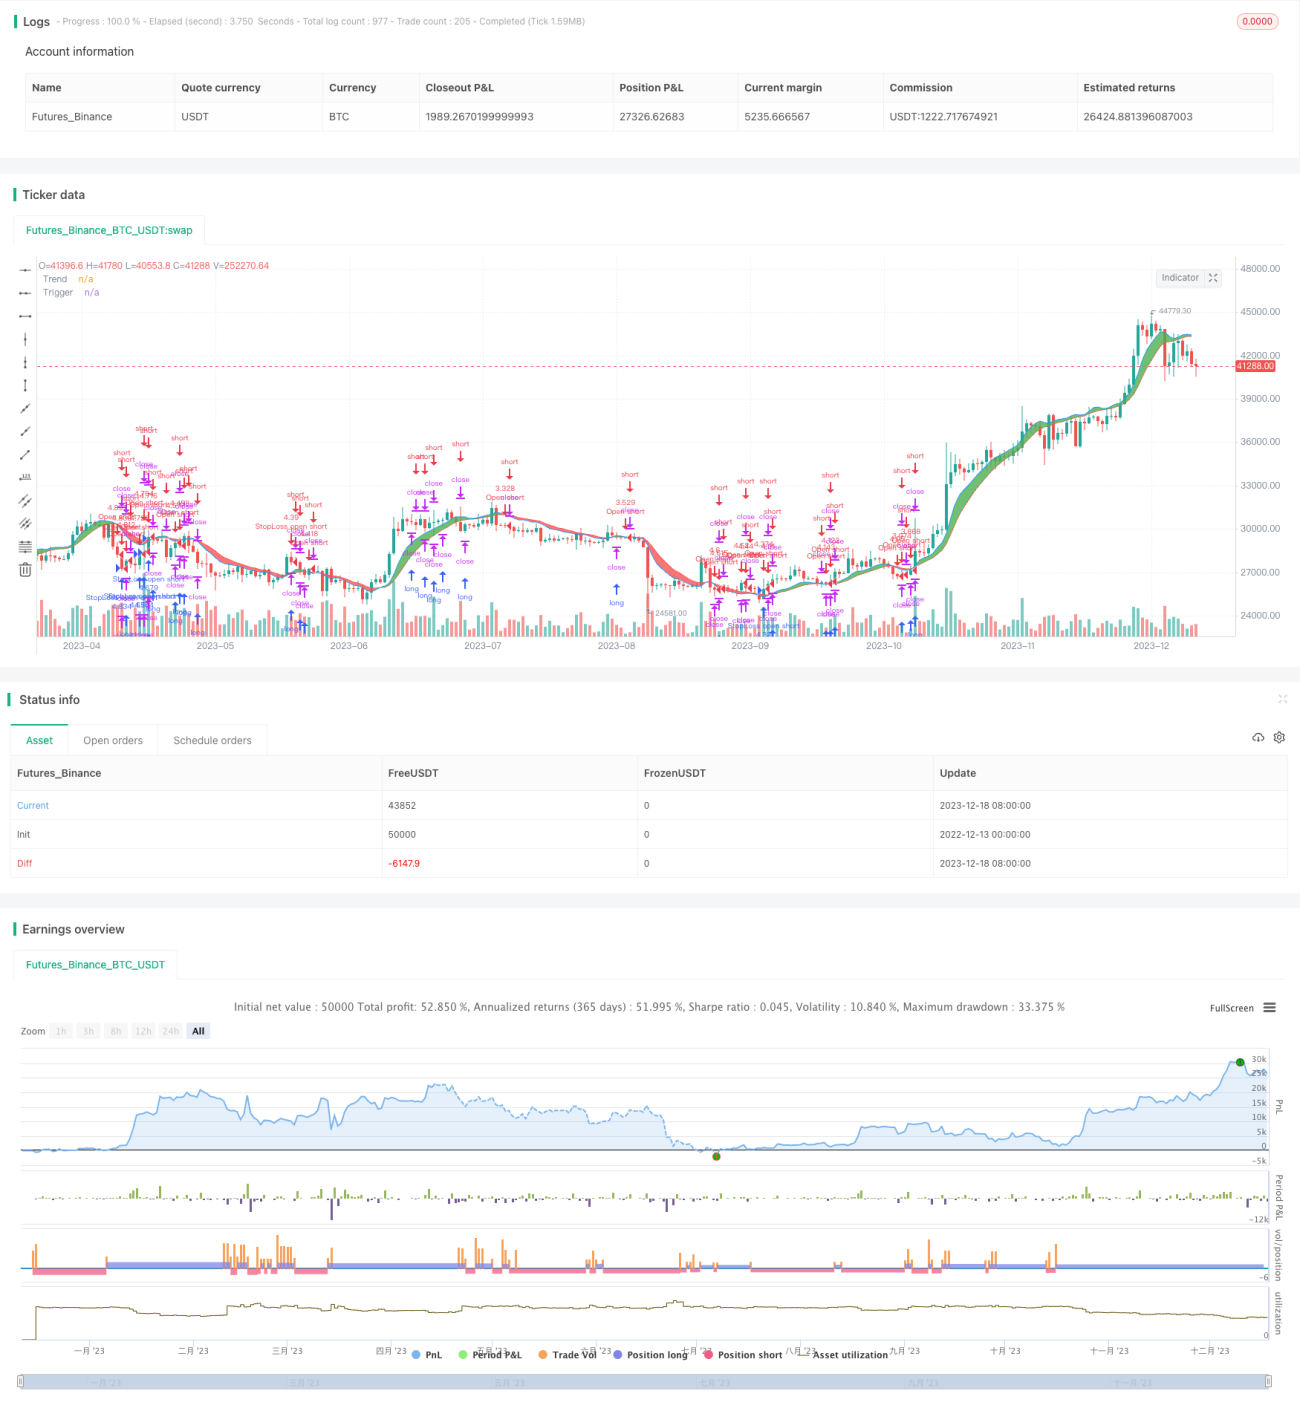
The Ehlers Instantaneous Trendline strategy is proposed by John Ehlers in his book "Cybernetic Analysis for Stocks and Futures". It utilizes technical indicators to identify real-time trends of stocks/futures and open positions when trends reverse.
Strategy Logic
The core of this strategy is calculating the Instantaneous Trendline (IT). The formula for IT is:
it := (a-((a*a)/4.0))*src+0.5*a*a*src[1]-(a-0.75*a*a)*src[2]+2*(1-a )*it[1]-(1-a )*(1-a )*it[2]
where src is the price, a is a smoothing factor, default to 0.07. This formula is a second order filter that can smooth the price and generate trends.
Another key indicator is the lag line, calculated by:
lag = 2.0 * it - nz(it[2])
The lag line lags IT line by one bar. When price crosses above lag line, it signals an upside breakout, go long. When price crosses below lag line, it signals a downside breakout, go short.
In addition, the strategy sets stop loss orders to control risks.
Advantage Analysis
The advantages of this strategy include:
- IT line effectively filters noise and improves signal quality
- The 2nd order filter provides more tuning flexibility and robustness
- Lag line avoids unnecessary whipsaws within trends
- Incorporated stop loss controls risks at predefined levels
- Clean code structure, easy to understand and modify
Risk Analysis
There are also some risks with this strategy:
- Improper parameter tuning of IT/lag line may generate false signals
- Bad stop loss configuration could result in premature stop out or oversized loss
- High trading frequency leads to accumulated commission fees
- Long holding times increases loss magnification risk
These risks can be alleviated by:
- Applying machine learning for parameter optimization
- Setting adaptive stop loss levels
- Reducing position sizes to lower trade frequencies
- Incorporating holding period stop losses
Optimization Directions
This strategy can be further optimized in the following aspects:
- Test impacts of different filter parameters to find optimum
- Try combining other indicators to filter signals
- Improve entry logic to size up during trend acceleration stages
- Set up adaptive stop loss based on market volatility
- Conduct time series analysis on trading sessions and frequencies
Conclusion
Overall, the Ehlers Instantaneous Trendline strategy utilizes technical indicators to identify real-time trends in stocks/futures and open positions when trends reverse. It has the advantages of effective noise filtering, high parameter tuneability, clear signal generation logic, and incorporated risk control. With further optimization on parameter selection, signal filtering, position sizing and stop loss tuning, this strategy can achieve even better performance. The clear code structure also makes it easy to understand and modify. In summary, this is an efficient trend following system worth testing and improving.
/*backtest
start: 2022-12-13 00:00:00
end: 2023-12-19 00:00:00
period: 1d
basePeriod: 1h
exchanges: [{"eid":"Futures_Binance","currency":"BTC_USDT"}]
*/

//@version=3
strategy("Ehlers Instantaneous Trendline Strategy", shorttitle = "Ehlers Instantaneous Trendline Strategy", overlay = true, default_qty_type = strategy.percent_of_equity, default_qty_value = 100.0, pyramiding = 1, backtest_fill_limits_assumption = 1)
src = input(hl2, title="Source")
a = input(0.07, title="Alpha", step=0.01) - 1