Overview
This strategy opens positions based on the golden cross and death cross of moving averages, and sets take profit and stop loss in a floor-crossing way. Its main features are:
- Use moving average system to filter shocks
- Adopt moving take profit and stop loss for dynamic capital management
- Configurable position filtering to avoid one-way opening
Strategy Principle
The strategy consists of four parts:
- Moving Average System
Use golden cross and death cross of moving averages to determine trends and filter shocks.
- Moving Take Profit and Stop Loss
Use take profit and stop loss with a certain percentage to lock in profits and control risks, realizing dynamic capital management.
- Position Filtering
Can configure whether to enable position filtering. If the previous position is long, the next signal must be short to open position, avoiding unilateral holding.
- ATR Stop Loss
Use ATR to limit the maximum range of stop loss and avoid excessive stop loss.
Specifically, the strategy first calculates the moving average, longs on golden cross, and shorts on death cross. After entry, set the moving take profit and stop loss lines with a certain percentage. If price touches the take profit line, then take profit; if touches the stop loss line or exceeds the ATR stop loss range, then stop loss.
Advantages
The main advantages of this strategy are:
- High Configurability
Many parameters in the strategy are configurable for users to adjust based on their trading styles.
- Good Capital Management
The adoption of moving take profit and stop loss and ATR stop loss can effectively control the amplitude of a single stop loss and achieve excellent capital management.
- Suitable for Trending Market
The moving average strategy itself is more suitable for strong trending markets to filter shocks effectively.
Risks and Countermeasures
There are also some risks in this strategy:
- Trend Misjudgement
The judgment of moving averages on complex markets is not perfect, and misjudgements may occur. At this time, moving average parameters should be adjusted accordingly, or other indicators can be combined to judge trends.
- Excessive Stop Loss
Moving stop loss may be negated in shocks. ATR parameters should be combined to set the stop loss range.
- One-way Opening Risks
Enabling position filtering will have some impact on trading frequency. Prolonged one-way holding may bring additional risks.
Optimization Directions
The main optimization directions are:
- Parameter Optimization
Adjust the moving average cycle, ATR parameters, take profit and stop loss ratios and other parameters to optimize strategy performance.
- Adding indicators
Add indicators like CMF, OBV to judge capital flow and avoid excessive stop loss.
- Combining with other strategies
Combine with breakout strategies to follow trends after the trend stabilizes to achieve better results.
Summary
In summary, through the moving average filter and moving take profit and stop loss, this strategy realizes dynamic capital management based on trends. It has high configurability, suitable for rational investors to adjust and use according to their own styles. As a universal quantitative strategy, it still has great potential for optimization and is worth in-depth research.
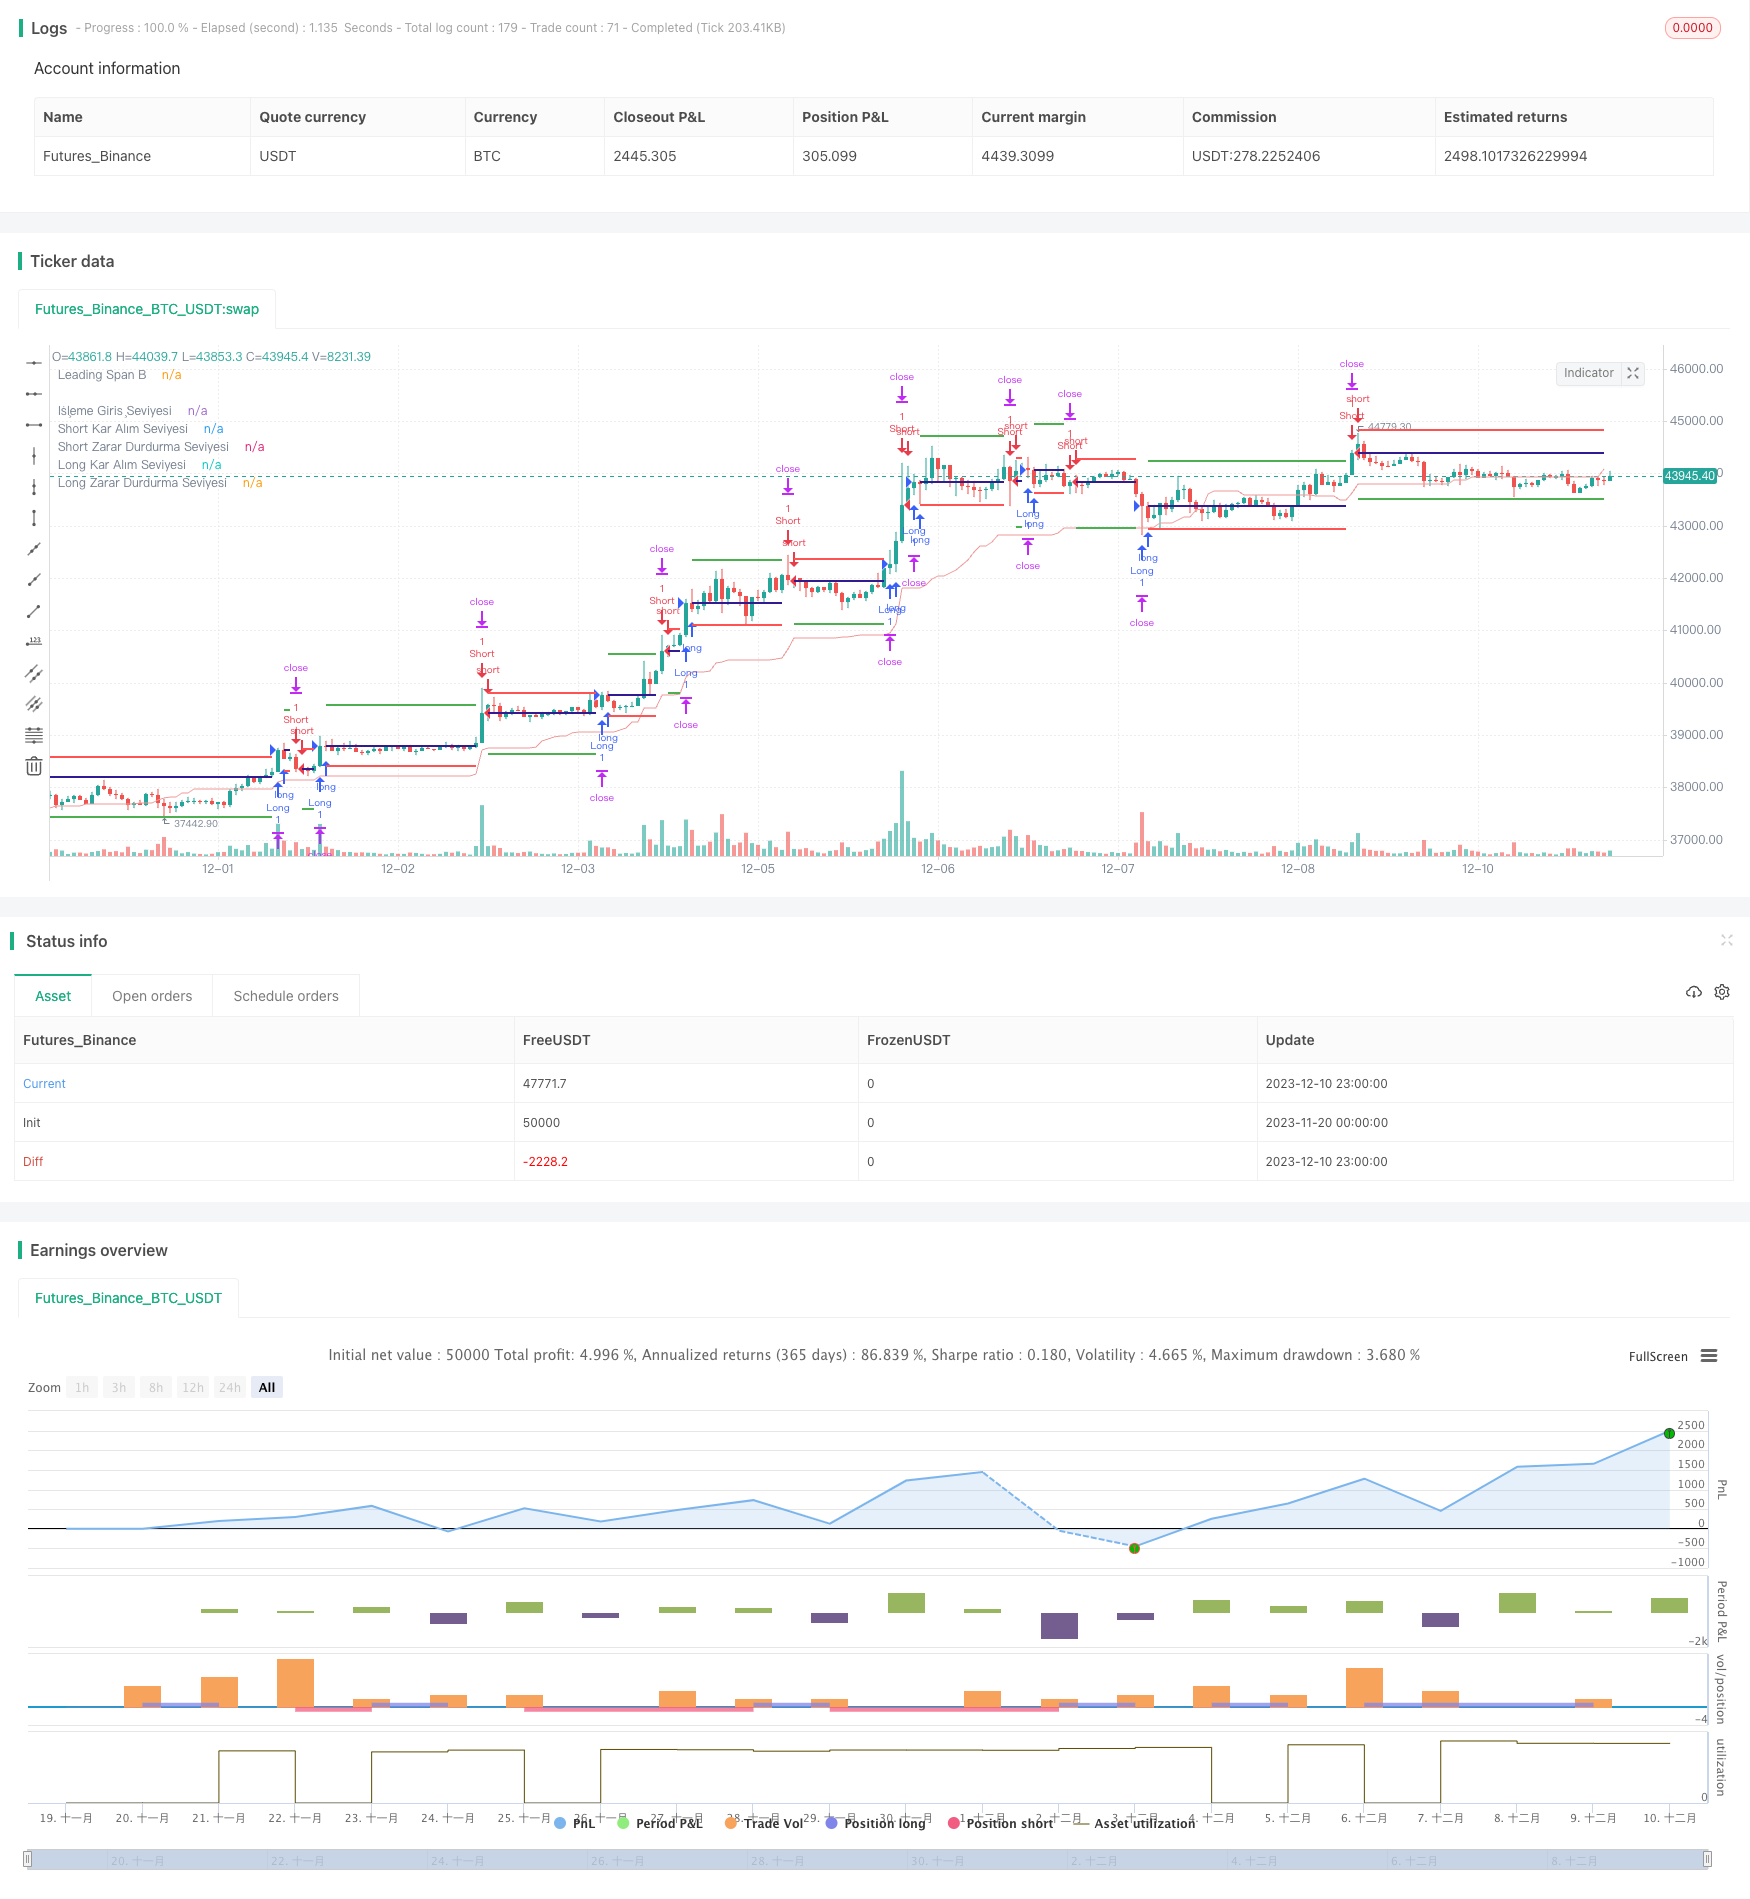
/*backtest
start: 2023-11-20 00:00:00
end: 2023-12-11 00:00:00
period: 1h
basePeriod: 15m
exchanges: [{"eid":"Futures_Binance","currency":"BTC_USDT"}]
*/

// This source code is subject to the terms of the Mozilla Public License 2.0 at https://mozilla.org/MPL/2.0/
// © MGULHANN

//@version=5

//İchimoku Leading Span 2 Hesaplaması ve Girişleri
strategy("Stairs Gain Strategy - MG", overlay=true, margin_long=100, margin_short=100)
laggingSpan2Periods = input.int(52, minval=1, title="Leading Periot")
displacement = input.int(1, minval=1, title="Displacement")
donchian(len) => math.avg(ta.lowest(len), ta.highest(len))
leadLine2 = donchian(laggingSpan2Periods)
p2 = plot(leadLine2, offset = displacement - 1, color=#EF9A9A,
	 title="Leading Span B")

// İşlem Tekrarını Filtrele
filtreUygula = input.bool(true,title="Pozisyon Sıra Filtresi Uygula")

//Kar Al / Zarar Durdur Seviyeleri Girişleri
zararDurdurmaYuzde = input.float(1.0, title='Zarar Durdurma %', step=0.01) / 100
karAlmaYuzde = input.float(2.0, title='Kar Alma %', step=0.01) / 100

//ATR Hesaplaması
atrCarpani = input.float(0.3, title="ATR Çarpanı", step= 0.01)
atrDegeri = ta.atr(14) * atrCarpani

//ATR Değer Girişleri
atrbuyukdeger = input.float(0.01, title="ATR Üst Limit", step=0.01)
atrkucukdeger = input.float(0.06, title="ATR Alt Limit", step=0.01)

//Buy ve Sell Şartları
buycross =   ta.crossover(close,leadLine2[displacement-1]) ? atrDegeri > atrbuyukdeger : strategy.position_size == 0
sellcross = ta.crossover(leadLine2[displacement-1],close) ? atrDegeri < atrkucukdeger : strategy.position_size == 0

//KONTROL
var sonPozisyonYonu = 0
//Son kapanan pozisyon long ise degiskenin degerini 1 olarak ata
if strategy.position_size[1] > 0 and strategy.position_size == 0
    sonPozisyonYonu := 1

//Son kapanan pozisyon short ise degiskenin degerini -1 olarak ata
if strategy.position_size[1] < 0 and strategy.position_size == 0
    sonPozisyonYonu := -1

//eger filtre uygulama seçiliyse ve son pozisyon yönü long ise 'longFiltreSonuc' degiskenine false degeri ata ve bir sonraki pozisyonun long olmasını engelle
longFiltreSonuc = filtreUygula ? sonPozisyonYonu == 1 ? false : true : true

//eger filtre uygulama seçiliyse ve son pozisyon yönü short ise 'shortFiltreSonuc' degiskenine false degeri ata ve bir sonraki pozisyonun short olmasını engelle
shortFiltreSonuc = filtreUygula ? sonPozisyonYonu == -1 ? false : true : true

//LONG GİRİŞ
strategy.entry("Long", strategy.long, when=buycross and longFiltreSonuc)
longKarAl = strategy.position_avg_price * (1 + karAlmaYuzde)
longZararDurdur = strategy.position_avg_price * (1 - zararDurdurmaYuzde)
strategy.exit("Long Exit","Long",limit=longKarAl, stop=longZararDurdur)

//SHORT GİRİŞ
strategy.entry("Short", strategy.short, when=sellcross and shortFiltreSonuc)
shortKarAl = strategy.position_avg_price * (1 - karAlmaYuzde)
shortZararDurdur = strategy.position_avg_price * (1 + zararDurdurmaYuzde)
strategy.exit("Short Exit","Short",limit=shortKarAl, stop=shortZararDurdur)

//Kar Al ve Zarar Durdur Seviyelerinin Grafikte İşaretlenmesi
plot(strategy.position_size != 0 ? strategy.position_avg_price : na, color=color.navy, linewidth=2, style=plot.style_linebr, title="İşleme Giriş Seviyesi")
plot(strategy.position_size > 0 ? longKarAl : na, color=color.green, linewidth=2, style=plot.style_linebr, title="Long Kar Alım Seviyesi")
plot(strategy.position_size > 0 ? longZararDurdur : na, color=color.red, linewidth=2, style=plot.style_linebr, title="Long Zarar Durdurma Seviyesi")
plot(strategy.position_size < 0 ? shortKarAl : na, color=color.green, linewidth=2, style=plot.style_linebr, title="Short Kar Alım Seviyesi")
plot(strategy.position_size < 0 ? shortZararDurdur : na, color=color.red, linewidth=2, style=plot.style_linebr, title="Short Zarar Durdurma Seviyesi")

//plotshape(buycross,size=size.small,style=shape.labelup,location=location.belowbar,color=color.green,text="Al", offset = displacement-1, textcolor=color.white)
//plotshape(sellcross,size=size.small,style=shape.labeldown,location=location.abovebar,color=color.red,text="Sat", offset = displacement-1, textcolor=color.white)