Overview
This strategy generates trading signals based on Heikin Ashi candlesticks. Specifically, buy and sell signals are considered based on the crossover of the Heikin Ashi close price and the 75th percentile price level, as well as the Heikin Ashi close price being above certain moving averages.
Strategy Logic
The strategy uses Heikin Ashi candlesticks instead of regular candlesticks for analysis. The smoothed nature of Heikin Ashi candlesticks helps identify trends and reversals more clearly. Specifically, the strategy combines percentile channels and moving averages to generate trading signals:
- A long signal is generated when the Heikin Ashi close crosses above the 75th percentile level.
- A sell signal is triggered when the Heikin Ashi close crosses below the 5-period moving average.
Stop loss and trailing stop are also used to control downside risk per trade.
Advantages
- Heikin Ashi candles clearly identify trends and promptly spot reversals.
- Percentile channels help determine overbought/oversold conditions to time entries and exits.
- The use of stop loss and trailing stop proactively controls risk.
Risks
- Heikin Ashi candles have lag by design, which may result in missing best entry/exit prices.
- Percentile channels do not completely pinpoint trend reversals, leading to potential whipsaws.
- Improper stop loss placement could either cut profits short prematurely or allow unacceptable losses.
To mitigate the risks, parameters like moving average periods and stop loss percentages may need adjustment.
Enhancements
- Test different moving average combinations to find optimal parameters.
- Fine-tune percentile channel lengths to better identify price “hot zones”.
- Incorporate additional indicators to confirm signals and avoid false signals.
- Implement dynamic stop loss distances.
Conclusion
This strategy combines Heikin Ashi candles, percentile channels and moving averages to form a systematic approach, capable of identifying trends and controlling risk via stop loss. Further performance improvement can be expected by optimizing parameters and incorporating complementary indicators.
/*backtest
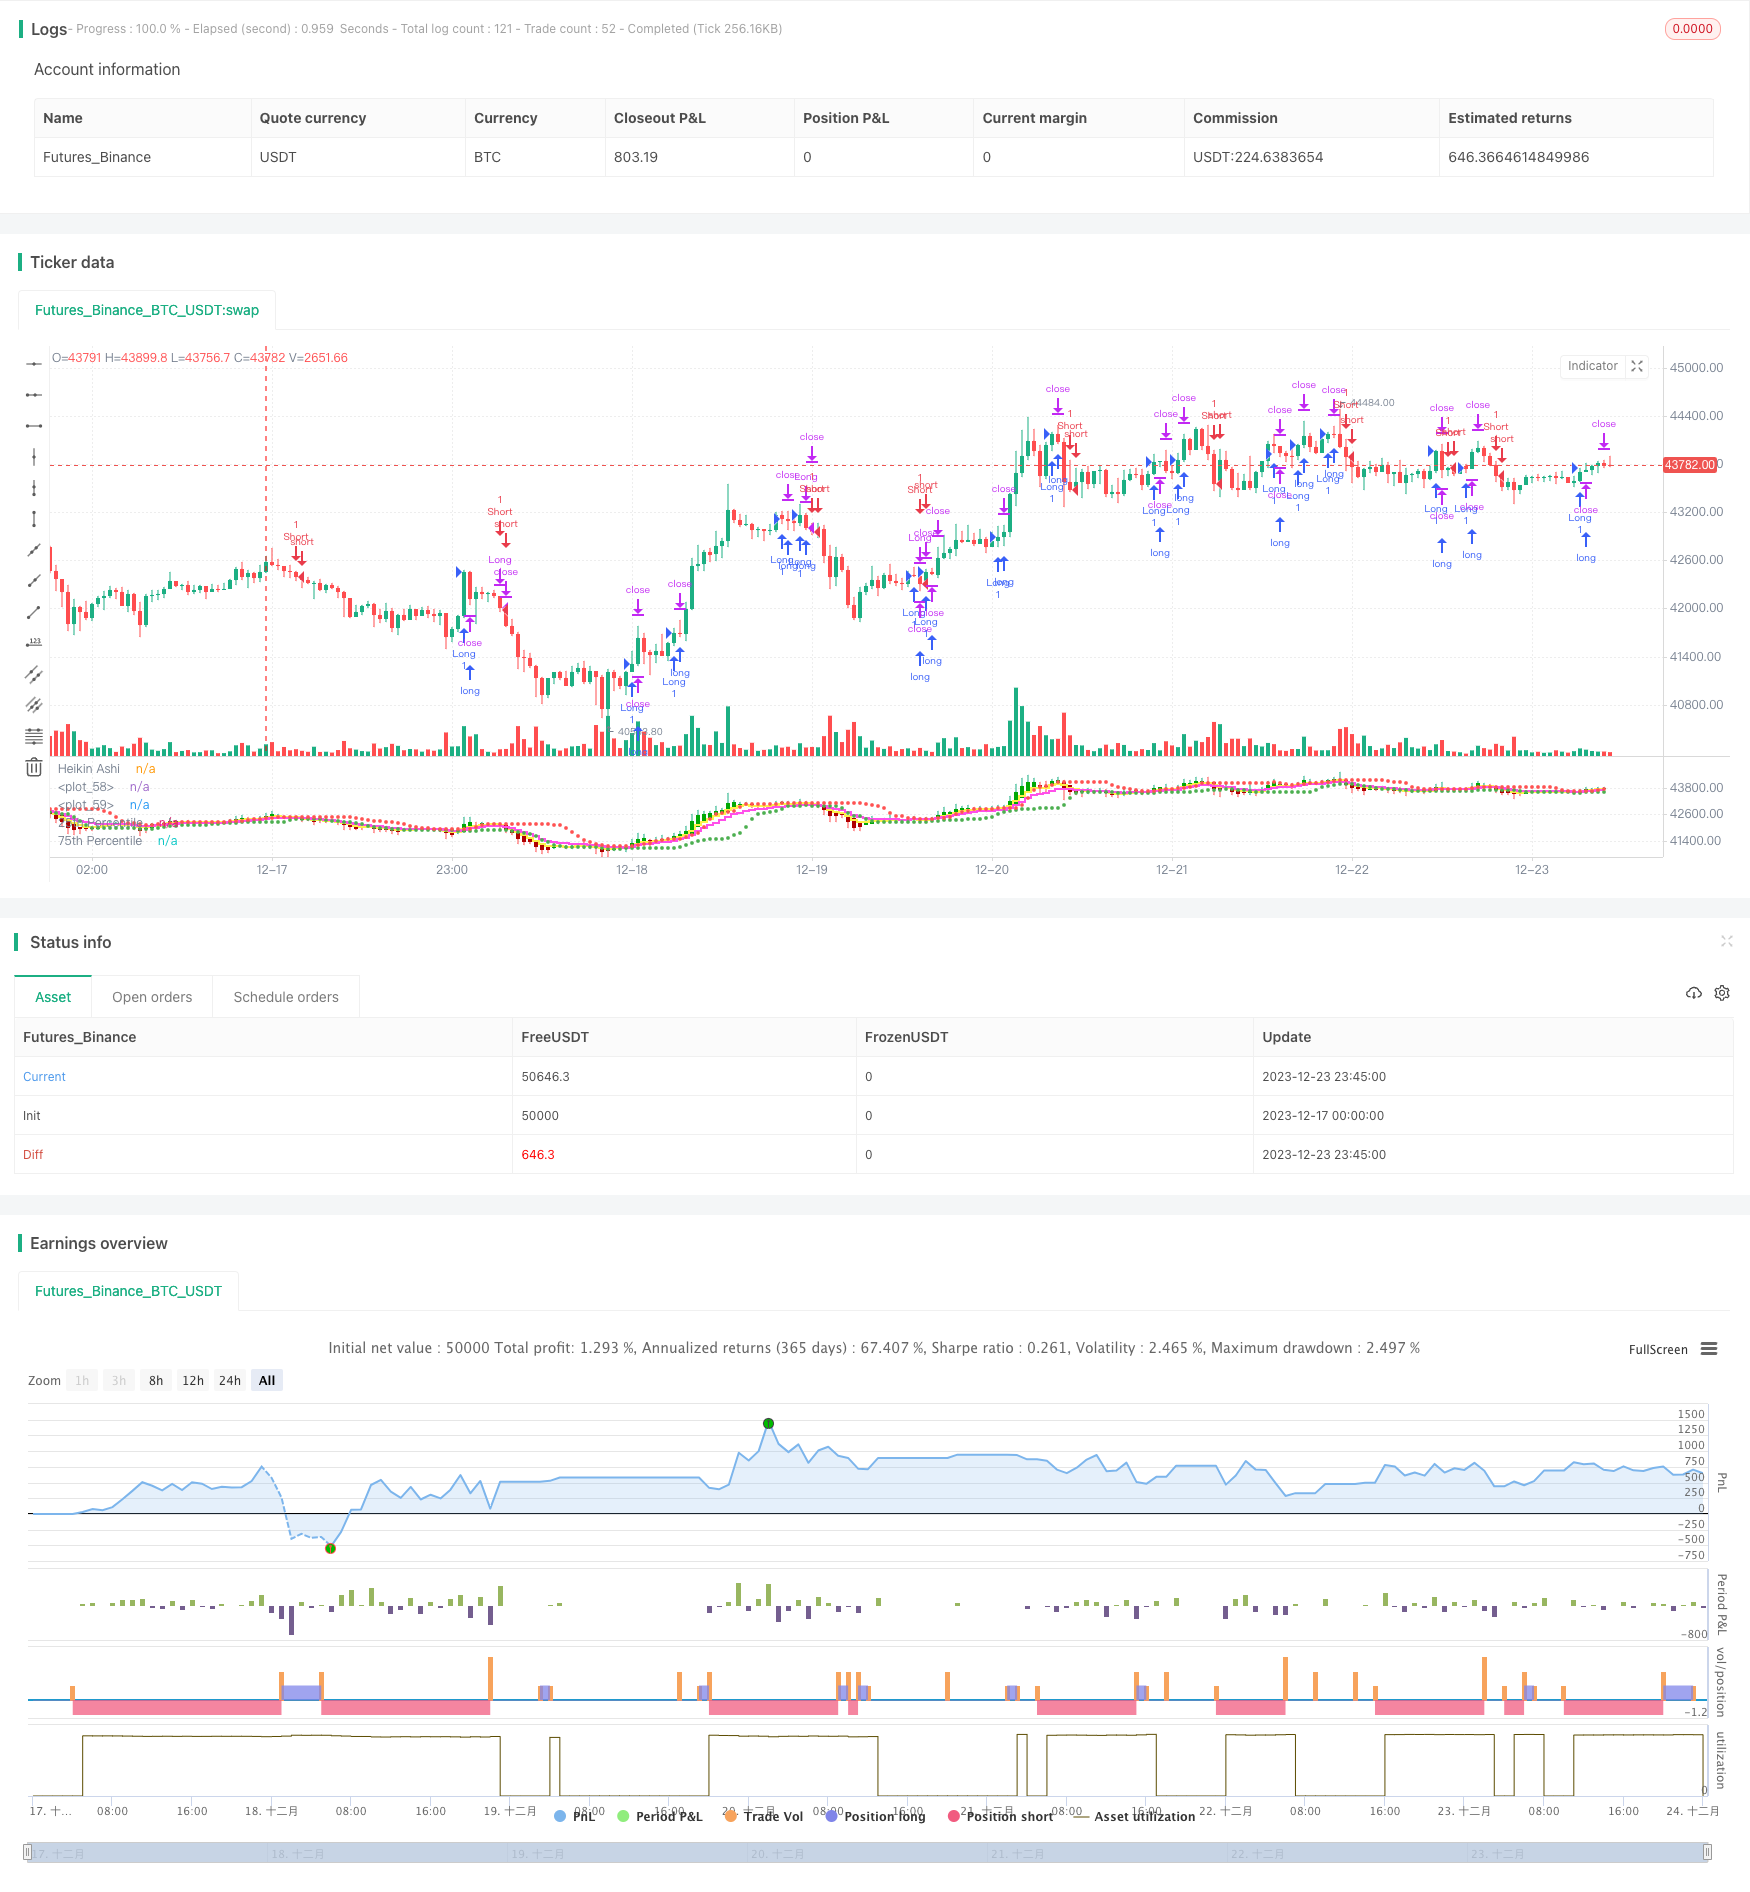
start: 2023-12-17 00:00:00
end: 2023-12-24 00:00:00
period: 45m
basePeriod: 5m
exchanges: [{"eid":"Futures_Binance","currency":"BTC_USDT"}]
*/
//@version=5
strategy("HK Percentile Interpolation One",shorttitle = "HKPIO", overlay=false, default_qty_type = strategy.cash, default_qty_value = 5000, calc_on_order_fills = true, calc_on_every_tick = true)
// Input parameters
stopLossPercentage = input(3, title="Stop Loss (%)") // User can set Stop Loss as a percentage
trailStopPercentage = input(1.5, title="Trailing Stop (%)") // User can set Trailing Stop as a percentage
lookback = input.int(14, title="Lookback Period", minval=1) // User can set the lookback period for percentile calculation
yellowLine_length = input.int(5, "Yellow", minval=1) // User can set the length for Yellow EMA
purplLine_length = input.int(10, "Purple", minval=1) // User can set the length for Purple EMA
holdPeriod = input.int(200, title="Minimum Holding Period", minval=10) // User can set the minimum holding period
startDate = timestamp("2021 01 01") // User can set the start date for the strategy
// Calculate Heikin Ashi values
haClose = ohlc4
var float haOpen = na
haOpen := na(haOpen[1]) ? (open + close) / 2 : (haOpen[1] + haClose[1]) / 2
haHigh = math.max(nz(haOpen, high), nz(haClose, high), high)
haLow = math.min(nz(haOpen, low), nz(haClose, low), low)
// Calculate Moving Averages
yellowLine = ta.ema(haClose, yellowLine_length)
purplLine = ta.ema(haClose, purplLine_length)
// Calculate 25th and 75th percentiles
p25 = ta.percentile_linear_interpolation(haClose, lookback, 28)
p75 = ta.percentile_linear_interpolation(haClose, lookback, 78)
// Generate buy/sell signals
longSignal = ta.crossover(haClose, p75) and haClose > yellowLine
sellSignal = ta.crossunder(haClose, yellowLine)
longSignal1 = ta.crossover(haClose, p75) and haClose > purplLine
sellSignal1 = ta.crossunder(haClose, purplLine)
// Set start time and trade conditions
if(time >= startDate)
// When longSignal is true, enter a long trade and set stop loss and trailing stop conditions
if (longSignal)
strategy.entry("Long", strategy.long, 1)
strategy.exit("Sell", "Long", stop=close*(1-stopLossPercentage/100), trail_points=close*trailStopPercentage/100, trail_offset=close*trailStopPercentage/100)
// When sellSignal is true, close the long trade
if (sellSignal)
strategy.close("Long")
// When sellSignal1 is true, enter a short trade
if (sellSignal1)
strategy.entry("Short", strategy.short, 1)
// When longSignal1 is true, close the short trade
if (longSignal1)
strategy.close("Short")
// Plot Heikin Ashi candles
plotcandle(haOpen, haHigh, haLow, haClose, title="Heikin Ashi", color=(haClose >= haOpen ? color.rgb(1, 168, 6) : color.rgb(176, 0, 0)))
// Plot 25th and 75th percentile levels
plot(p25, title="25th Percentile", color=color.green, linewidth=1, style=plot.style_circles)
plot(p75, title="75th Percentile", color=color.red, linewidth=1, style=plot.style_circles)
// Plot Moving Averages
plot(yellowLine, color = color.rgb(254, 242, 73, 2), linewidth = 2, style = plot.style_stepline)
plot(purplLine, color = color.rgb(255, 77, 234, 2), linewidth = 2, style = plot.style_stepline)