Overview
This article mainly explains a momentum oscillation trading strategy based on the Stochastic RSI indicator. The strategy adopts shorter cycle technical indicators (such as 30 minutes) to make trading decisions based on whether the Stochastic RSI enters the overbought/oversold region. Compared with other momentum strategies, this strategy combines the advantages of both RSI and Stochastic indicators to more accurately capture short-term market oscillations.
Strategy Principle
The core indicator of the strategy is Stochastic RSI. The calculation formula of Stochastic RSI is:
Stochastic RSI = (RSI - RSI Low) / (RSI High - RSI Low) * 100
Where RSI is calculated using the lengthRSI parameter (default 12), and Stochastic RSI is calculated using the lengthStoch parameter (default 12).
When Stochastic RSI is higher than the purple filled area, it is the overbought area, then go short; when Stochastic RSI is lower than the purple filled area, it is the oversold area, then go long.
In addition, the strategy also sets the moving average filter condition. Only when the fast EMA is higher than the slow EMA can you open a long position; only when the fast EMA is lower than the slow EMA can you open a short position. This avoids counter-trend trading.
Advantages of the Strategy
Compared with a single RSI strategy, this strategy combines the Stochastic indicator to more clearly identify overbought/oversold areas, thereby improving the reliability of signals.
Compared with a single Stochastic strategy, this strategy uses RSI as the input data source of Stochastic, which can filter out some noise and make the signal more reliable.
The moving average filter condition is set to effectively avoid counter-trend positions building, thereby reducing unnecessary losses.
The position holding time delay is set to avoid being stopped out by false breakouts.
Risks of the Strategy
The strategy mainly uses short-cycle indicators, so it is only suitable for short-term operations and may not perform well in the long run.
The Stochastic RSI indicator itself has a certain lag and may miss signals after drastic price changes in the short term.
In oscillating markets, Stochastic RSI may produce multiple penetrations of overbought/oversold areas, which may lead to overtrading and increased transaction costs.
Optimization Directions
Different parameter combinations can be tested to further optimize the length, K and D values of Stochastic RSI.
Different RSI length parameters can be tested to find a more appropriate RSI cycle.
Try combining with other indicators to further improve signal accuracy, such as MACD, Bollinger Bands, etc.
Test different position holding delay parameters to find a more appropriate exit timing.
Conclusion
This article details the construction principles, advantages, risks and optimization ideas of a momentum strategy based on the Stochastic RSI indicator. Compared with single indicator strategies, this strategy utilizes the strengths of both RSI and Stochastic to more clearly and reliably identify short-term overbought/oversold phenomena in the market for reversal trading. Further performance improvements can be expected through parameter optimization and indicator combinations.
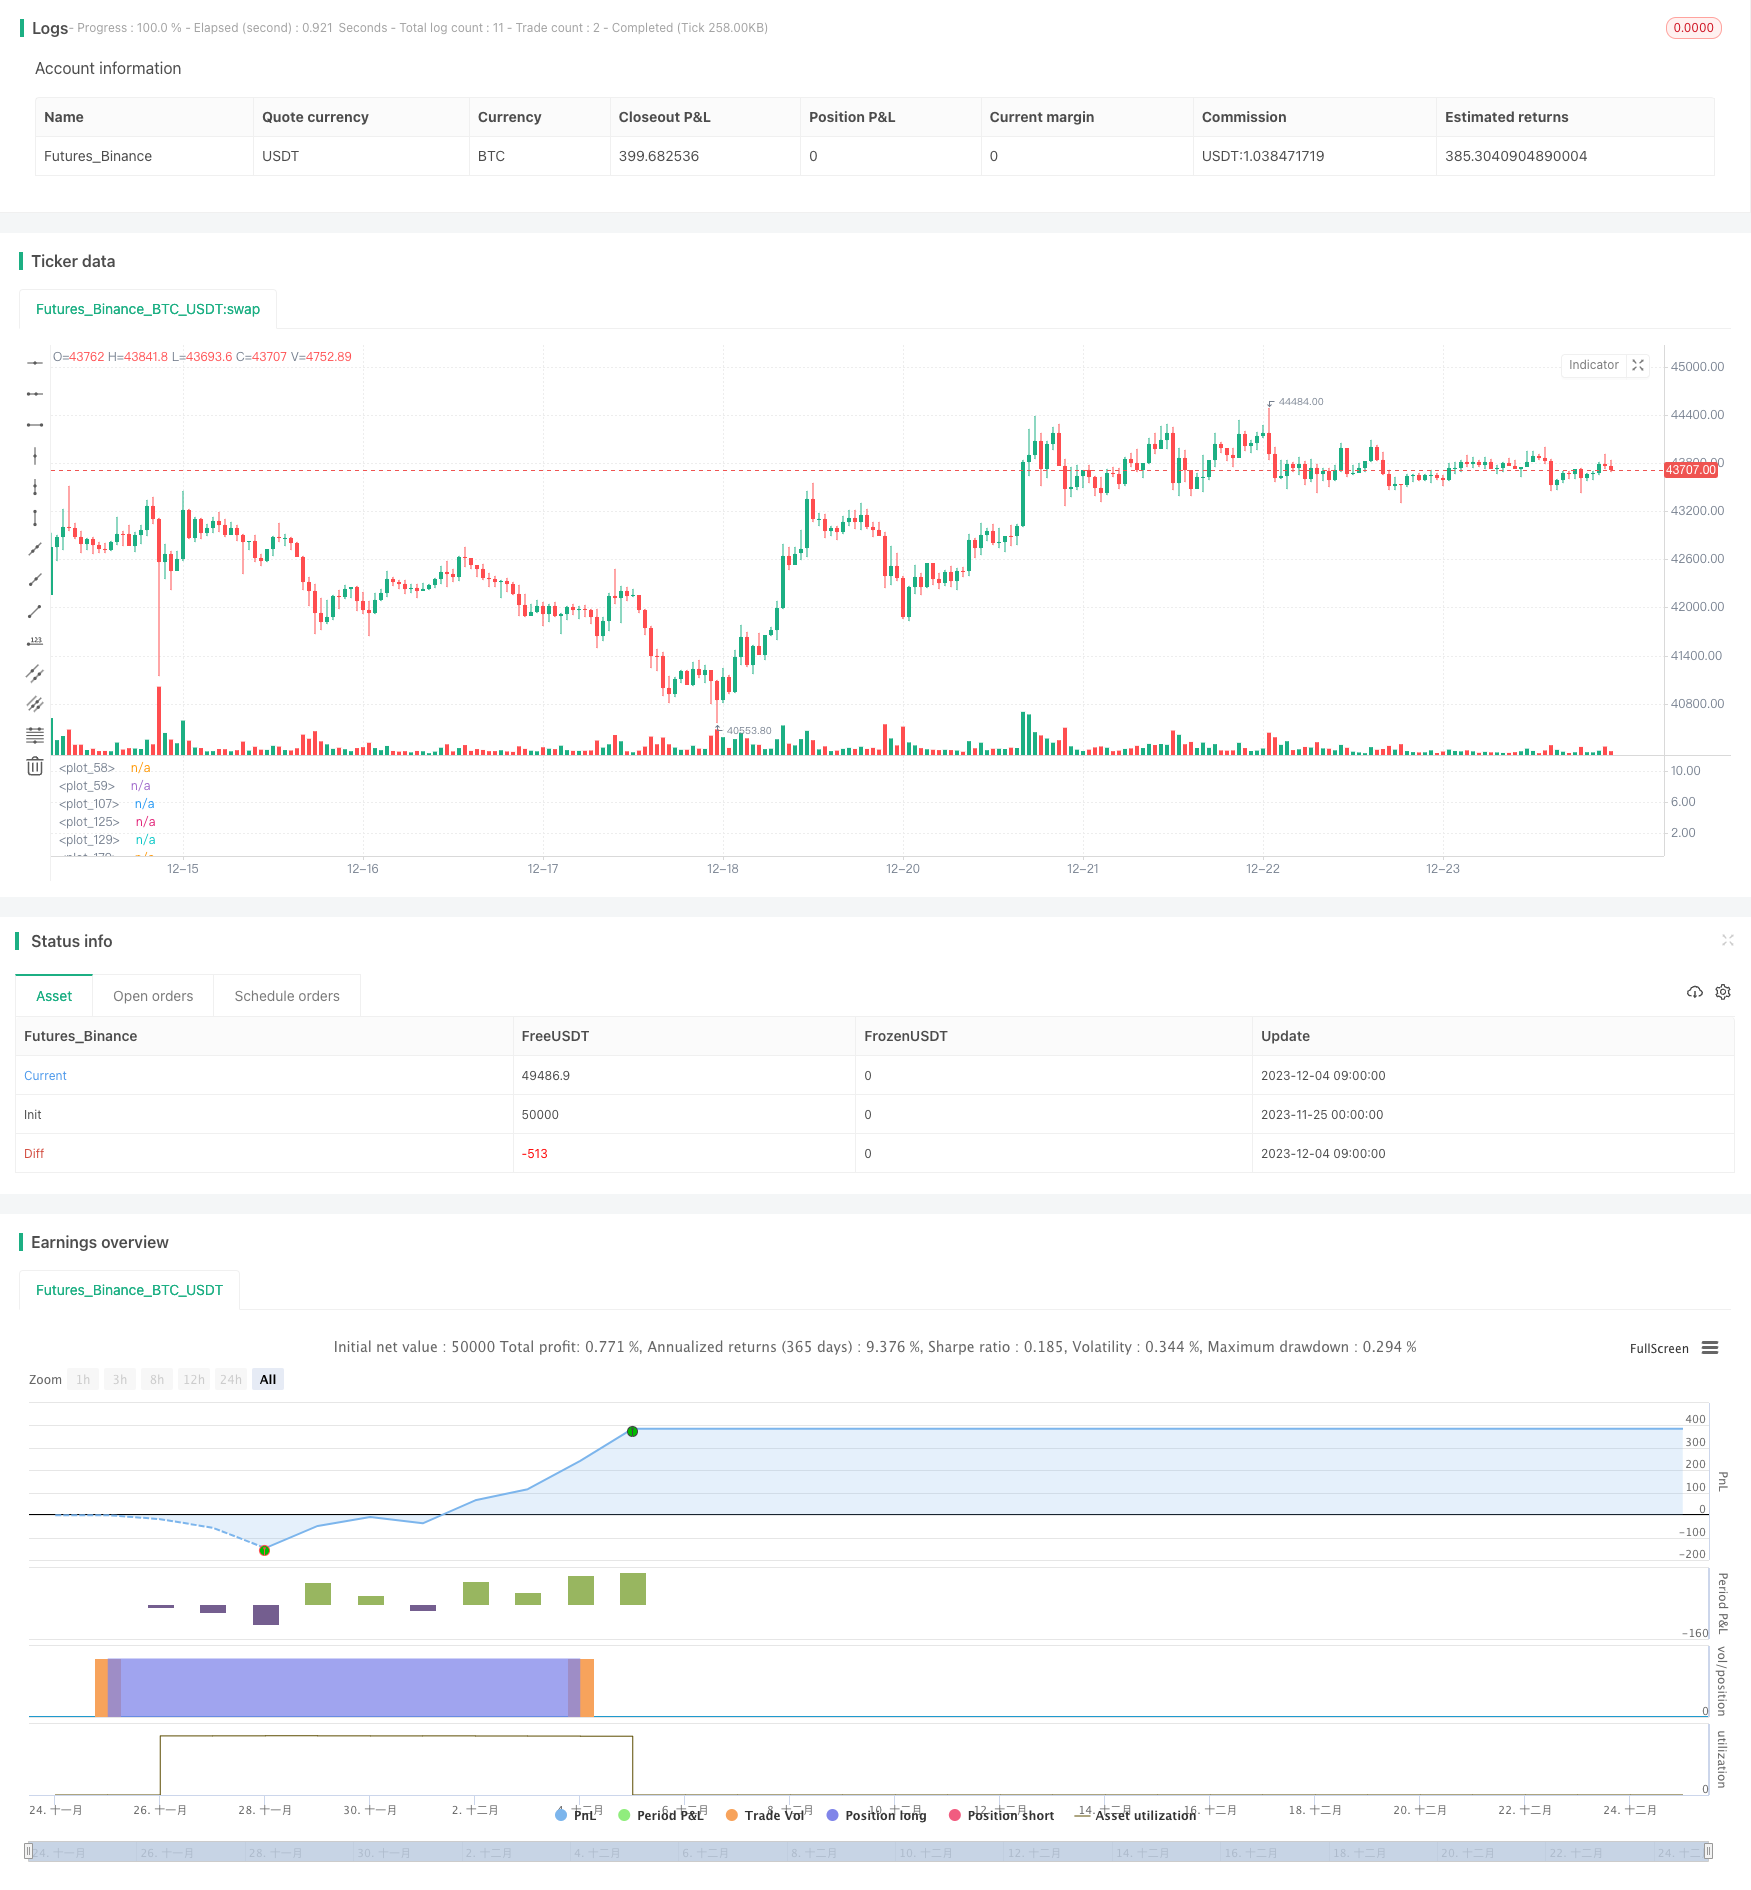
/*backtest
start: 2023-11-25 00:00:00
end: 2023-12-25 00:00:00
period: 1h
basePeriod: 15m
exchanges: [{"eid":"Futures_Binance","currency":"BTC_USDT"}]
*/

// This source code is subject to the terms of the Mozilla Public License 2.0 at https://mozilla.org/MPL/2.0/
// © Drun30 (Federico Magnani)

//@version=4
//STRATEGIA PRINCIPALE
capitaleIniziale=10000

var sizeordineInit= 50 // → % di capitale investita per ogni trade
var deltaSize = 25 // → delta% di capitale investito se trade precedente è stato in perdita
var sizeLimite = 100 //il trade non userà mai questa percentuale di capitale investito
var sizeordine = sizeordineInit

//Parametri ottimali 30 min
usiShort=false
usiLong=true
ipercomprato=85.29
ipervenduto=30.6
//

strategy("Momentum Strategy (V7.B.4)", initial_capital=capitaleIniziale, currency="USD", default_qty_type=strategy.percent_of_equity, commission_type=strategy.commission.percent, commission_value=0.1, slippage = 5, default_qty_value=sizeordineInit, overlay=false, pyramiding=0)

backtest = input(title="------------------------Backtest Period------------------------", defval = false)
start = timestamp(input(2020, "start year"), input(1, "start month"), input(1, "start day"), 00, 00)
end = timestamp(input(0, "end year"), input(0, "end month"), input(0, "end day"), 00, 00)

siamoindata=time > start?true:false
if end > 0
    siamoindata:=time > start and time <= end?true:false

basicParameters = input(title="------------------------Basic Parameters------------------------", defval = false)
smoothK = input(3, minval=1)
smoothD = input(6, minval=1)
lengthRSI = input(12, minval=1)
src = input(close, title="RSI Source")
rsi1 = rsi(src, lengthRSI)
lengthStoch = input(12, minval=1)
k = ema(stoch(rsi1, rsi1, rsi1, lengthStoch), smoothK)
d = ema(k, smoothD)
altezzaipercomprato= input(ipercomprato, title="Overbought Height", minval=1, type=input.float)
altezzaipervenduto= input(ipervenduto, title="Oversold Height", minval=1,type=input.float)

BarsDelay = input(6,title="Bars delay",minval=0)

GambleSizing = input(true, title = "Gamble Sizing?",type=input.bool)
gambleAdd = input(deltaSize,title="Gamble Add (%)",minval=0,type=input.integer)
gambleLimit = input(sizeLimite,title="Gamble MAX (%)",minval=0,type=input.integer)
if GambleSizing and strategy.closedtrades[0]>strategy.closedtrades[1]
    if strategy.losstrades[0]>strategy.losstrades[1] and sizeordine<gambleLimit
        sizeordine:=sizeordine+gambleAdd
    if strategy.wintrades[0]>strategy.wintrades[1]
        sizeordine:=sizeordineInit

periodomediamobile_fast = input(1, title="Fast EMA length",minval=1)
periodomediamobile_slow = input(60, title="Slow EMA length",minval=1)

plot(k, color=color.blue)
plot(d, color=color.orange)
h0 = hline(altezzaipercomprato)
h1 = hline(altezzaipervenduto)
fill(h0, h1, color=color.purple, transp=80)
// n=input(Vicinanzadalcentro,title="Vicinanza dal centro",minval=0)
//sarebbe il livello di D in cui si acquista o si vende, maggiore è la vicinanza maggiore sarà la frequenza dei trades, SE 0 è DISABILITATO

//     siamoinipervenduto= d<=altezzaipervenduto and d<=d[n] and d>d[1]?true:false //and d<d[3] and d>d[1]
//     siamoinipercomprato= d>=altezzaipercomprato and d>=d[n] and d<d[1]?true:false //and d>d[3] and d<d[1]
goldencross = crossover(k,d)
deathcross = crossunder(k,d)
// METTI VARIABILE IN CUI AVVIENE CROSSOVER O CROSSUNDER
valoreoro = valuewhen(goldencross,d,0)
valoremorte = valuewhen(deathcross,d,0)

siamoinipervenduto = goldencross and valoreoro<=altezzaipervenduto?true:false//d<=altezzaipervenduto?true:false
siamoinipercomprato = deathcross and valoremorte>=altezzaipercomprato?true:false//d>=altezzaipercomprato?true:false

long_separator = input(title="------------------------LONG------------------------", defval = usiLong)

sl_long_inp = input(10, title="Stop Loss LONG %", type=input.float)
tp_long_inp = input(8, title="Take Profit LONG %",type=input.float)
stop_level_long = strategy.position_avg_price * (1 - (sl_long_inp/100)) //strategy.position_avg_price corrisponde al prezzo con cui si è aperta la posizione
take_level_long = strategy.position_avg_price * (1 + (tp_long_inp/100))

//BINANCE
JSON_long = 'OPEN LONG: PUT THE JSON HERE FOR THE API CALL'
JSON_chiusura = 'CLOSE POSITION: PUT THE JSON HERE FOR THE API CALL'

webhookLong = JSON_long
webhookClose= JSON_chiusura

trendFilterL = input(title="TREND FILTER LONG?", defval = true)

EMAfast=ema(close,periodomediamobile_fast)
EMAslow=ema(close,periodomediamobile_slow)

siamoinuptrend_ema=EMAfast>EMAslow?true:false //close>=EMAfast and EMAfast>EMAslow
siamoinuptrend = siamoinuptrend_ema

// CondizioneAperturaLong = siamoinipervenduto and siamoindata // and siamoinuptrend
CondizioneAperturaLong = siamoinipervenduto and siamoindata and long_separator
if trendFilterL
    CondizioneAperturaLong := siamoinipervenduto and siamoindata and long_separator and siamoinuptrend

CondizioneChiusuraLong = siamoinipercomprato and siamoindata

possiamoAprireLong=0
if trendFilterL and siamoinuptrend
    possiamoAprireLong:=5
plot(possiamoAprireLong,color=color.green)

sonPassateLeBarreG = barssince(CondizioneAperturaLong) == BarsDelay?true:false
sonPassateLeBarreD = barssince(CondizioneChiusuraLong) == BarsDelay?true:false

haiUnLongAncoraAperto = false
haiUnLongAncoraAperto := strategy.position_size>0?true:false

// Se l'ultimo valore della serie "CondizioneAperturaLong" è TRUE, allora hai un long ancora aperto
// Se l'ultimo valore della serie "CondizioneAperturaLong" è FALSE, allora:
//       Se l'ultimo valore della serie "CondizioneChiusuraLong" è TRUE, allora NON hai un long ancora aperto
//       Se l'ultimo valore della serie "CondizioneChiusuraLong" è FALSE, allora restituisce l'ultimo valore della serie "haiUnLongAncoraAperto"

haiUnLongAncoraAperto_float = if(haiUnLongAncoraAperto==true)
    10
else
    0

plot(haiUnLongAncoraAperto_float,color=color.red) //FInché la linea rossa si trova a livello "1" allora c'è un ordine long in corso

quantita = (sizeordine/100*(capitaleIniziale+strategy.netprofit))/valuewhen(haiUnLongAncoraAperto==false and CondizioneAperturaLong,close,0)

plot(sizeordine,color=color.purple, linewidth=3)

if  strategy.position_size<=0 and CondizioneAperturaLong //and sonPassateLeBarreG and haiUnLongAncoraAperto==false strategy.opentrades==0
    strategy.entry("Vamonos",strategy.long, alert_message=webhookLong, comment="OPEN LONG", qty=quantita)

if  strategy.position_size>0 //and sonPassateLeBarreD // and CondizioneChiusuraLong
    if siamoinuptrend == true and sonPassateLeBarreD
        strategy.close("Vamonos", alert_message=webhookClose, comment="CLOSE LONG")
    else if siamoinuptrend == false and CondizioneChiusuraLong
        strategy.close("Vamonos", alert_message=webhookClose, comment="CLOSE LONG")


if strategy.position_size>0 and siamoindata
    strategy.exit("Vamonos", stop=stop_level_long, limit=take_level_long, comment="CLOSE LONG (LIMIT/STOP)")


short_separator = input(title="------------------------SHORT------------------------", defval = usiShort)

sl_short_inp = input(20, title="Stop Loss SHORT %")
tp_short_inp = input(35, title="Take Profit SHORT %")
stop_level_short = strategy.position_avg_price * (1 + (sl_short_inp/100))
take_level_short= strategy.position_avg_price * (1 - (tp_short_inp/100))

// BINANCE
JSON_short = 'OPEN SHORT: PUT THE JSON HERE FOR THE API CALL'

webhookShort = JSON_short

trendFilterS = input(title="TREND FILTER SHORT?", defval = true)

siamoindowntrend_ema=EMAfast<EMAslow?true:false //close<=EMAfast and EMAfast<EMAslow
siamoindowntrend=siamoindowntrend_ema

CondizioneAperturaShort = short_separator and siamoinipercomprato and siamoindata
if trendFilterS
    CondizioneAperturaShort:=short_separator and siamoinipercomprato and siamoindata and siamoindowntrend

CondizioneChiusuraShort = siamoinipervenduto and siamoindata

sonPassateLeBarreGs = barssince(CondizioneAperturaShort) == BarsDelay?true:false
sonPassateLeBarreDs = barssince(CondizioneChiusuraShort) == BarsDelay?true:false

haiUnoShortAncoraAperto = false
haiUnoShortAncoraAperto := strategy.position_size<0?true:false

haiUnoShortAncoraAperto_float = if(haiUnoShortAncoraAperto==true)
    15
else
    0

plot(haiUnoShortAncoraAperto_float,color=color.purple) //FInché la linea viola si trova a livello "2" allora c'è un ordine short in corso

if CondizioneAperturaShort and strategy.position_size>=0 //and haiUnoShortAncoraAperto==false
    strategy.entry("Andale",strategy.short,alert_message=webhookShort, comment="OPEN SHORT")

if  strategy.position_size<0 //and sonPassateLeBarreD // and CondizioneChiusuraLong
    if siamoindowntrend == true and sonPassateLeBarreDs
        strategy.close("Andale",alert_message=webhookClose, comment="CLOSE SHORT")
    else if siamoindowntrend == false and CondizioneChiusuraShort
        strategy.close("Andale",alert_message=webhookClose, comment="CLOSE SHORT")

if strategy.position_size<0 and siamoindata
    strategy.exit("Andale", stop=stop_level_short, limit=take_level_short, comment="CLOSE SHORT (LIMIT/STOP)")