1. Strategy Overview
This strategy is named “Up versus Down Close Candles Strategy with EMA filter and Session Timeframes”. It counts the number of up close and down close candles in a certain lookback period to determine the market sentiment, combined with EMA filter and trading in specific sessions, to identify long and short signals.
2. Strategy Logic
The core logic is to count the number of up close candles (upCloseCount) and down close candles (downCloseCount) in the recent lookback period. If upCloseCount is larger, it indicates a bullish market. If downCloseCount is larger, it indicates a bearish market. EMA indicator is used as a filter, only considering long when price > EMA, and short when price < EMA. It also sets session1 and session2 as trading sessions.
Detailed logic:
Long signal triggers when: inSession is true (in trading sessions) and upCloseCount > downCloseCount (more up close candles) and close > ema (close price higher than EMA) and currentSignal is not “long” (no existing position).
Short signal triggers when: inSession is true and downCloseCount > upCloseCount (more down close candles) and close < ema (close price lower than EMA) and currentSignal is not “short” (no existing position).
3. Advantage Analysis
- Captures market sentiment and trend by comparing up close/down close candles history
- Use EMA filter to avoid trading in ranging markets
- Avoid noise in non-major trading hours by setting sessions
- Balance between trend following and trading frequency
4. Risk Analysis
- Can be misled in sideways markets
- Improper EMA parameter may cause ineffective filter
- Missing opportunities if session set inappropriately
- Unable to capture gap caused by events
Solutions:
1. Optimize EMA parameter
2. Optimize trading sessions
3. Add stop loss based on ATR
4. Identify events, avoid gaps
5. Optimization Directions
- Optimize trading sessions
- Optimize EMA parameters
- Add ATR based stop loss
- Identify events, avoid gaps
- Combining with other indicators for better filter
- Test and adjust across products
6. Summary
This strategy identifies trend signals by comparing up close and down close candles and using EMA filter, within preset trading sessions. It has some trend following effect but also risks of false signals. Improve by optimizing parameters, adding stop loss, enhancing filters etc. Evaluate thoroughly in backtest.
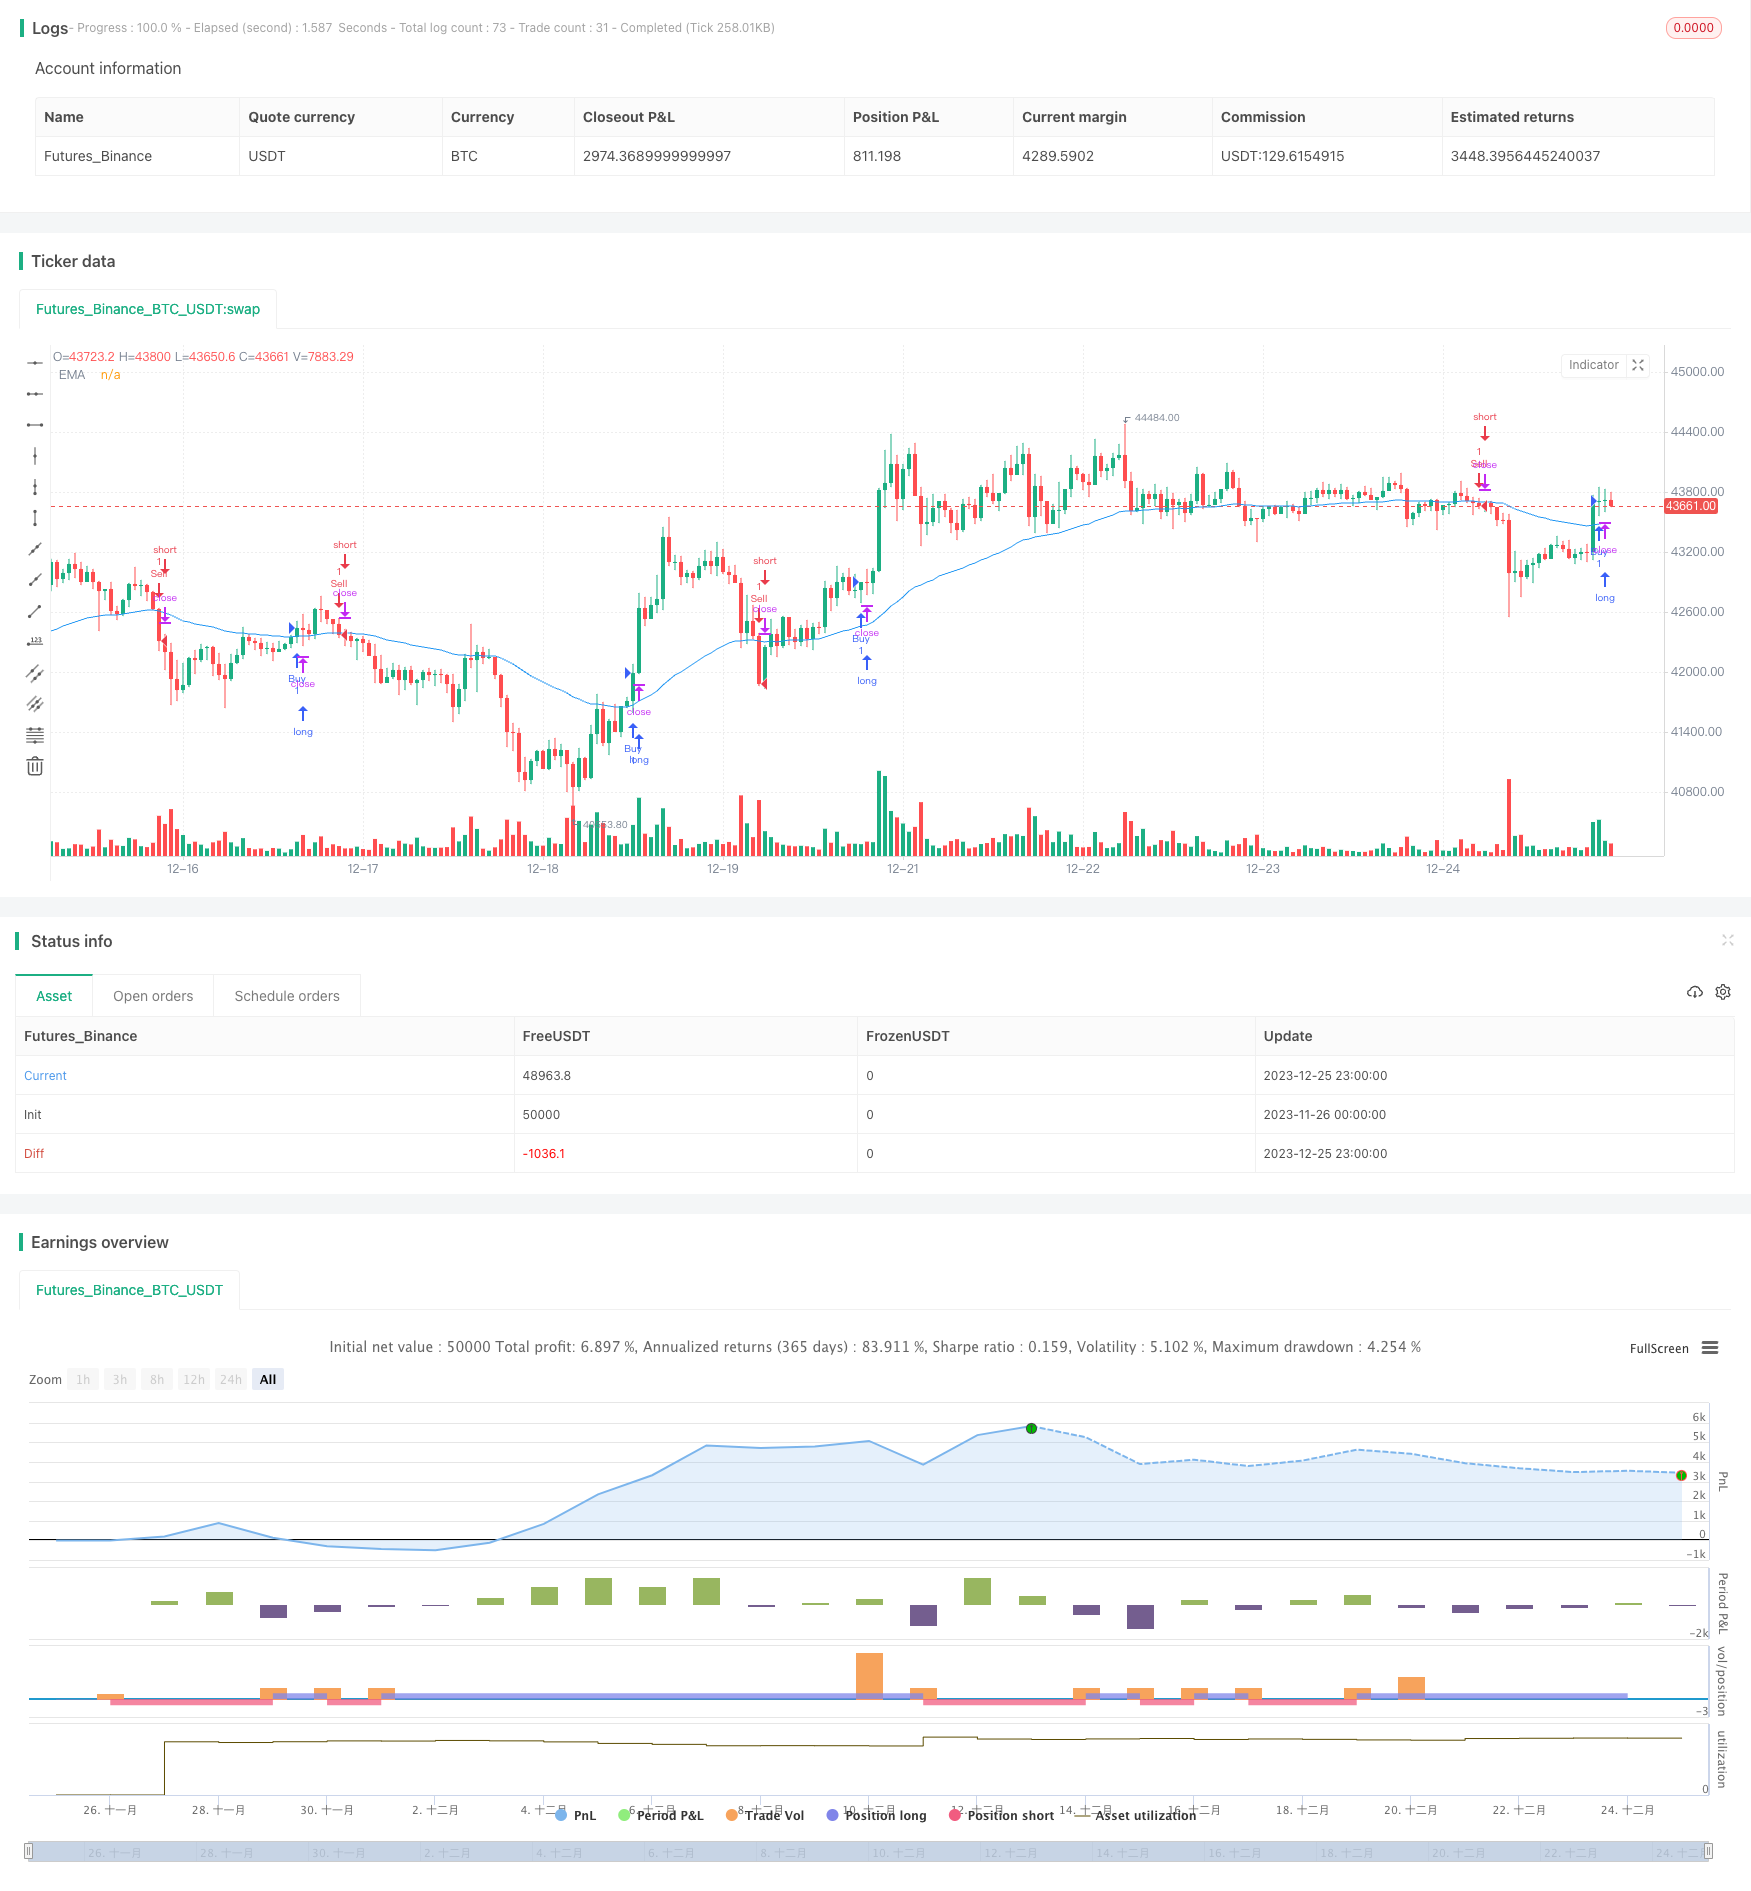
/*backtest
start: 2023-11-26 00:00:00
end: 2023-12-26 00:00:00
period: 1h
basePeriod: 15m
exchanges: [{"eid":"Futures_Binance","currency":"BTC_USDT"}]
*/

//@version=5
strategy("Up vs Down Close Candles Strategy with EMA and Session Time Frames", shorttitle="UvD Strat EMA Session", overlay=true)

// User input to define the lookback period, EMA period, and session strings for time frames
int lookback = input(20, title="Lookback Period")
int emaPeriod = input(50, title="EMA Period")
string session1 = input("0900-1200", title="Time Frame 1 Session")
string session2 = input("1300-1600", title="Time Frame 2 Session")

// Calculate the EMA
float ema = ta.ema(close, emaPeriod)

// State variable to track the current signal
var string currentSignal = na

// Counting up-close and down-close candles within the lookback period
int upCloseCount = 0
int downCloseCount = 0

if barstate.isnew
    upCloseCount := 0
    downCloseCount := 0
    for i = 0 to lookback - 1
        if close[i] > close[i + 1]
            upCloseCount += 1
        else if close[i] < close[i + 1]
            downCloseCount += 1

// Define the long (buy) and short (sell) conditions with EMA filter and session time frame
bool inSession = time(timeframe.period, session1) or time(timeframe.period, session2)
bool longCondition = inSession and upCloseCount > downCloseCount and close > ema and currentSignal != "long"
bool shortCondition = inSession and downCloseCount > upCloseCount and close < ema and currentSignal != "short"

// Enter or exit the market based on conditions
if longCondition
    currentSignal := "long"
    strategy.entry("Buy", strategy.long)

if shortCondition
    currentSignal := "short"
    strategy.entry("Sell", strategy.short)

// Exit logic for long and short positions
if currentSignal == "long" and strategy.position_size <= 0
    strategy.close("Sell")

if currentSignal == "short" and strategy.position_size >= 0
    strategy.close("Buy")

plot(ema, color=color.blue, title="EMA")