Overview
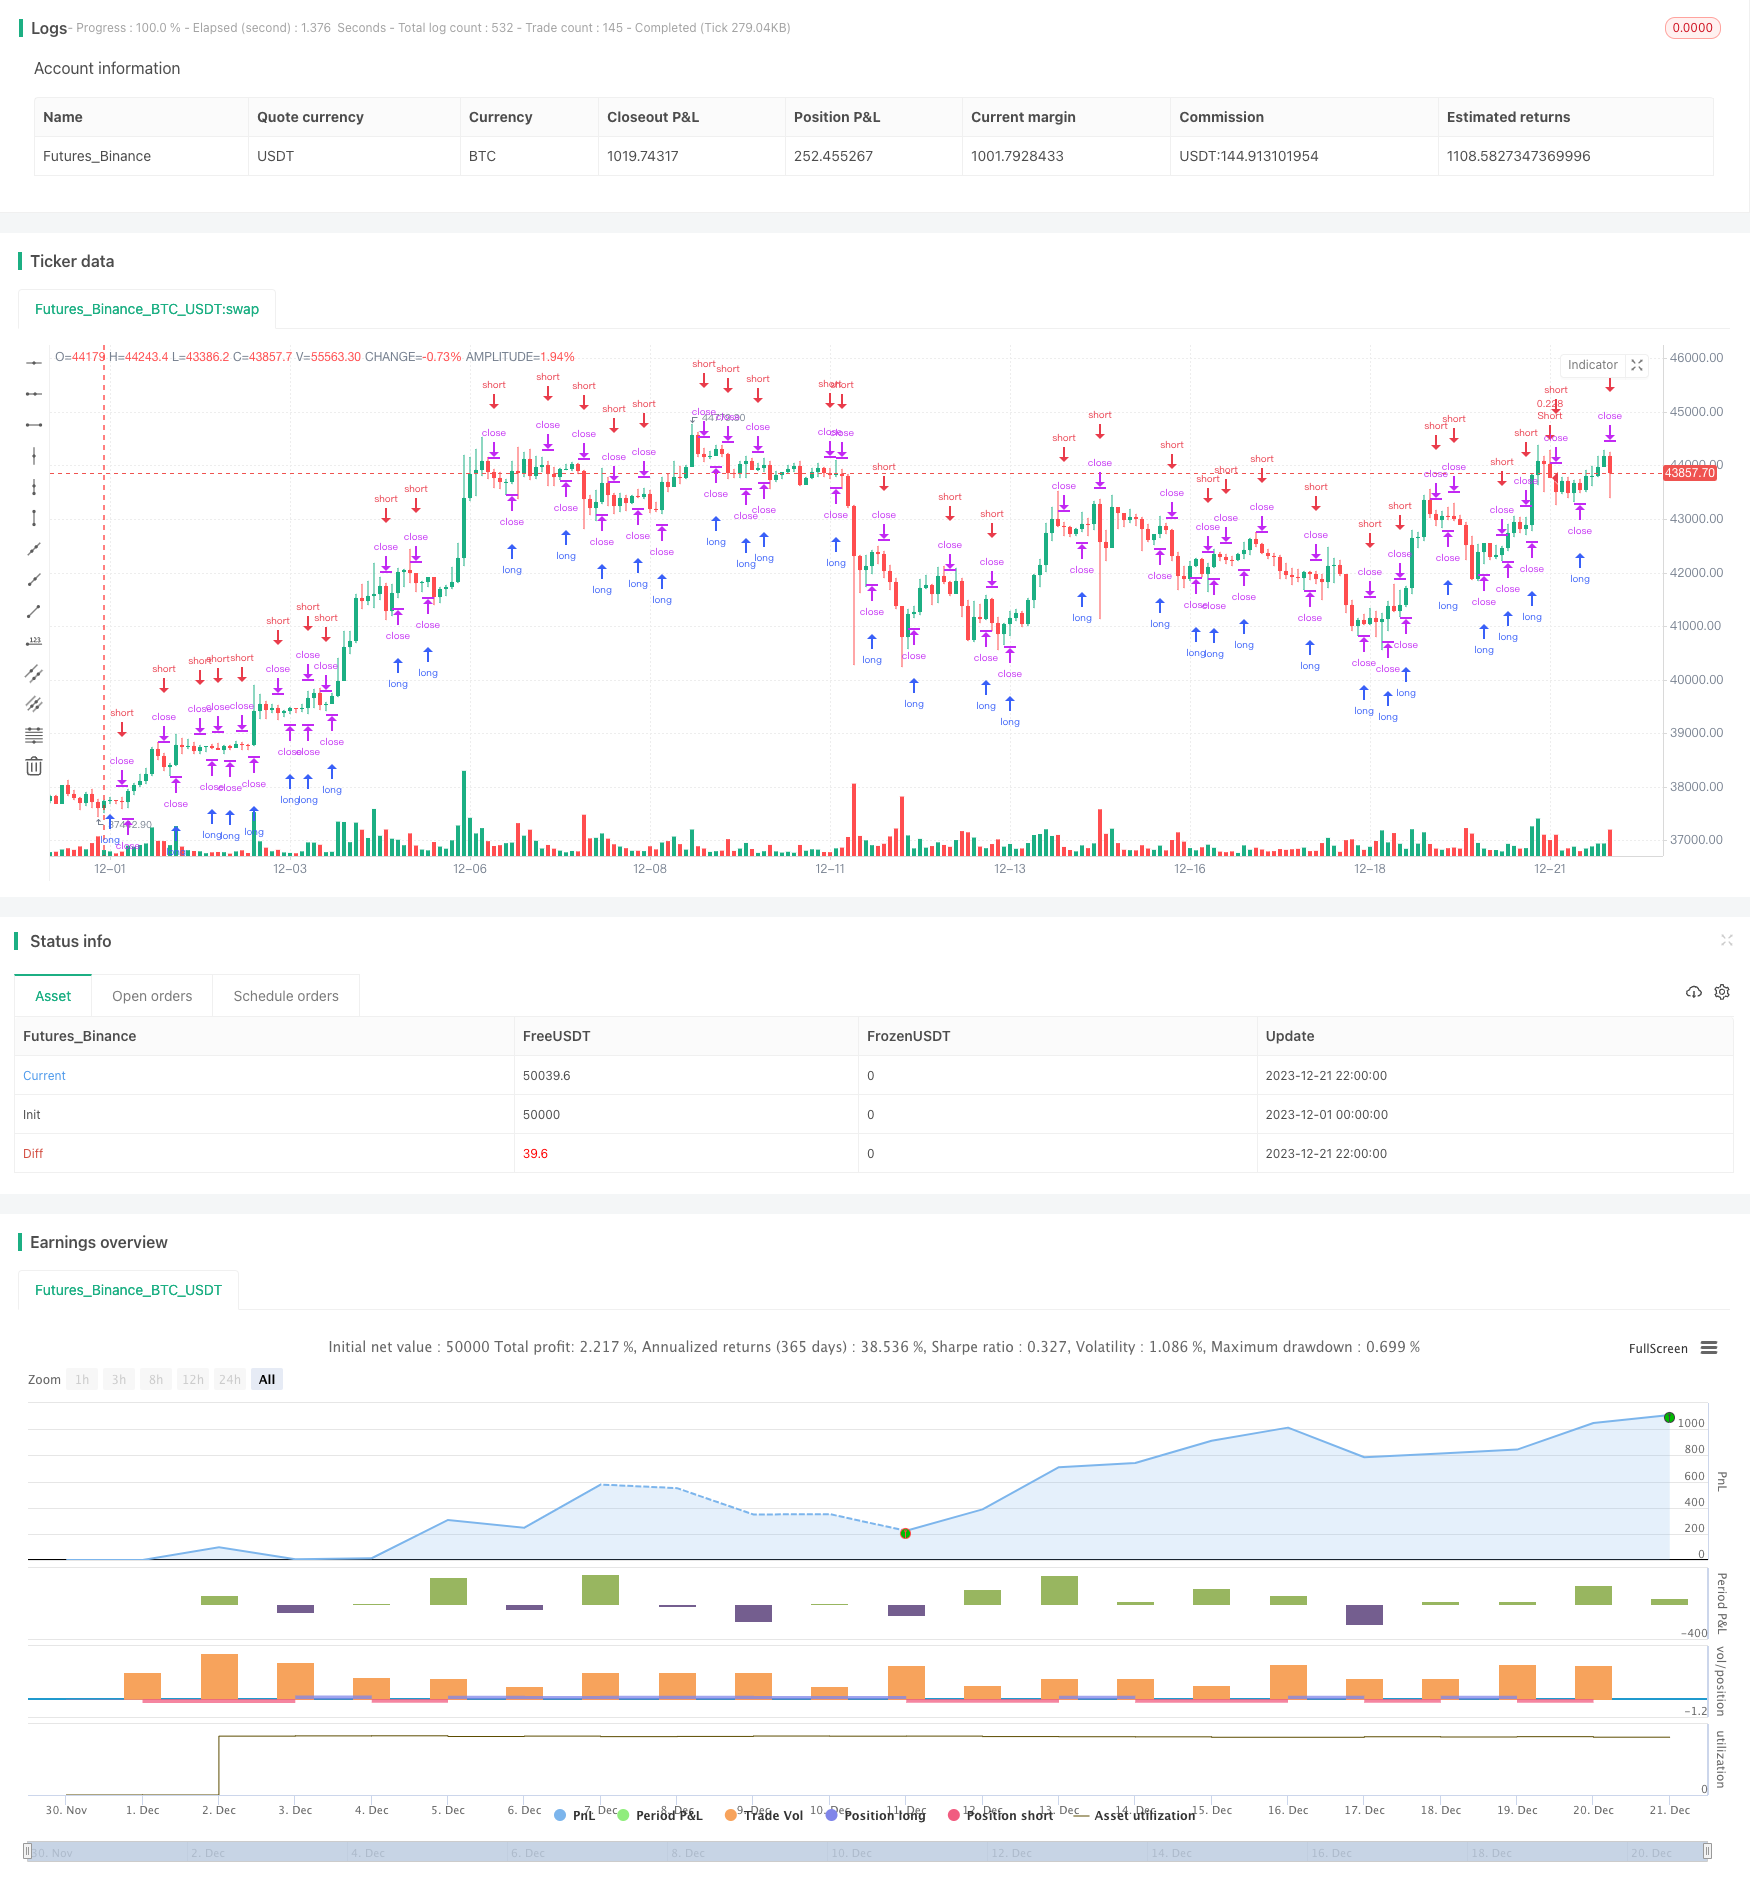
This strategy utilizes a K-line pattern based judgment method to implement high frequency market making arbitrage. Its main idea is to open and close trades for high frequency market making by judging bullish/bearish patterns across different K-line timeframes. Specifically, the strategy concurrently monitors multiple K-line timeframes and takes corresponding long or short positions when it observes consecutive rising or falling K-lines.
Strategy Logic
The core logic of this strategy lies in judging bullish/bearish patterns across different K-line timeframes. Specifically, it concurrently tracks 1-min, 5-min and 15-min K-lines. The strategy determines current sentiment by checking if prices have risen or fallen compared to N previous K-lines. If prices consecutively rise, it indicates a bullish sentiment; if prices consecutively fall, it signals a bearish view. Upon bullish signals, the strategy goes long; upon bearish signals, the strategy goes short. In this way, the strategy could capture trend and mean-reversion opportunities across different timeframes for high frequency arbitrage.
The core logic is implemented by tracking two indicators ups and dns, which record the number of consecutive rising and falling K-lines. Parameters consecutiveBarsUp and consecutiveBarsDown allow customization of the threshold for determining a trend. When ups is greater than or equal to consecutiveBarsUp, it signals a bullish pattern; when dns exceeds consecutiveBarsDown, it indicates a bearish pattern. In addition, the strategy specifies back-testing time range and order execution messages etc.
Advantages
The advantages of this strategy include:
- Capture high frequency arbitrage opportunities for market making
- Simple and effective logic based on K-line patterns
- Concurrent monitoring of multiple timeframes improves capture rate
- Intuitive parameter tuning
- Configurable back-testing time range for optimization
Risks
There are also several risks to be aware of:
- General risks of high frequency trading like data issues, order failures etc.
- Improper parameter tuning might lead to over-trading or missing good chances
- Cannot handle more complex market conditions like whipsaws
Possible ways to mitigate the risks include:
- Incorporate more logic to determine prudent entry/exit
- Optimize parameter to balance trade frequency and profitability
- Consider more factors like volume, volatility to judge trends
- Test different stop loss mechanism to limit per trade loss
Enhancement Opportunities
This strategy can be enhanced from the following dimensions:
- Add more factors to judge patterns beyond simple rise/fall counts, like amplitude, energy etc.
- Evaluate other entry/exit indicators like MACD, KD etc.
- Incorporate technical factors like MA, channels to filter signals
- Optimize parameters across timeframes to find best combinations
- Develop stop loss and take profit mechanisms to improve stability
- Introduce quant risk controls like maximum positions, trade frequency etc.
- Test across different products to find best fitting
Conclusion
This strategy realizes a simple yet effective high frequency arbitrage strategy based on K-line pattern judgment. Its core lies in capturing intraday bullish/bearish trends across timeframes for arbitrage. Despite some inherent risks, this easy to understand strategy serves a good starting point for algorithmic trading. Further enhancements around optimization and risk management will likely generate more stable and profitable results.
/*backtest
start: 2023-12-01 00:00:00
end: 2023-12-21 23:59:59
period: 2h
basePeriod: 15m
exchanges: [{"eid":"Futures_Binance","currency":"BTC_USDT"}]
*/

//@version=4

// Strategy
strategy("Up/Down Strategy", initial_capital = 10000, default_qty_value = 10000, default_qty_type = strategy.cash)

consecutiveBarsUp = input(1)
consecutiveBarsDown = input(1)

price = close

ups = 0.0
ups := price > price[1] ? nz(ups[1]) + 1 : 0

dns = 0.0
dns := price < price[1] ? nz(dns[1]) + 1 : 0

// Strategy Backesting
startDate  = input(timestamp("2021-01-01T00:00:00"), type = input.time)
finishDate = input(timestamp("2021-12-31T00:00:00"), type = input.time)

time_cond  = true

// Messages for buy and sell
message_buy  = input("{{strategy.order.alert_message}}", title="Buy message")
message_sell = input("{{strategy.order.alert_message}}", title="Sell message")

// Strategy Execution

if (ups >= consecutiveBarsUp) and time_cond
    strategy.entry("Long", strategy.long, stop = high + syminfo.mintick, alert_message = message_buy)

if (dns >= consecutiveBarsDown) and time_cond
    strategy.entry("Short", strategy.short, stop = low + syminfo.mintick, alert_message = message_sell)

//plot(strategy.equity, title="equity", color=color.red, linewidth=2, style=plot.style_areabr)