Overview
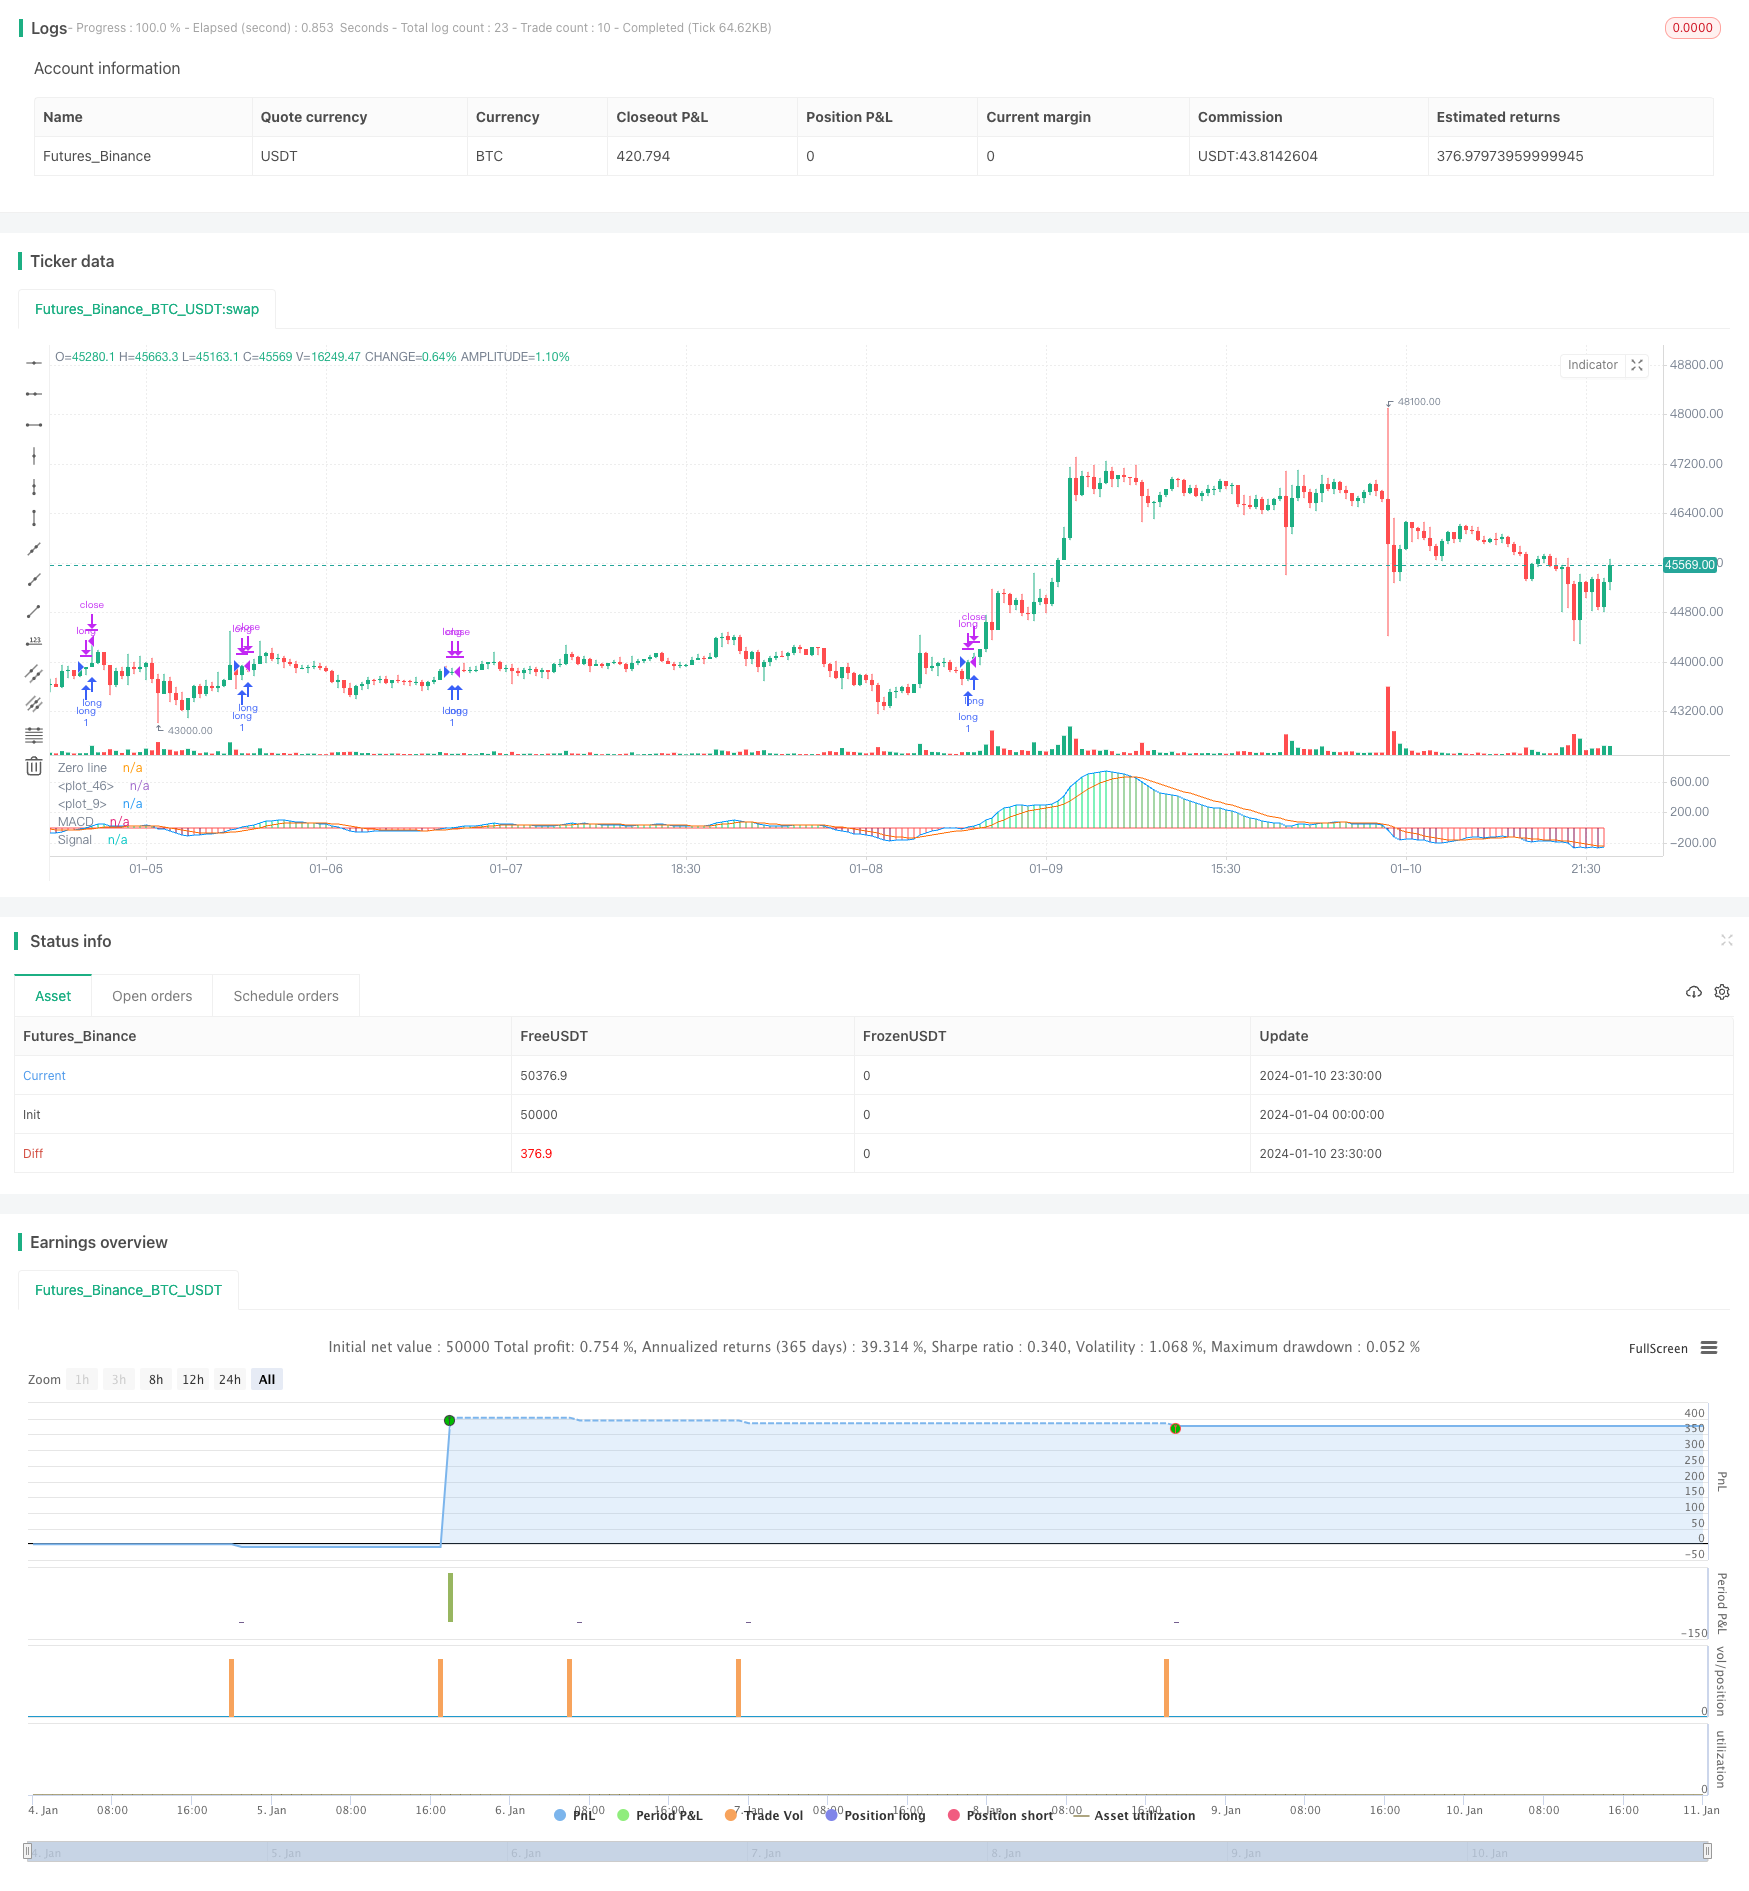
This strategy is based on the MACD indicator and long and close lines to implement long-term trading of the currency pair. It opens positions when the MACD indicator line crosses over the long line and closes positions when the MACD indicator line crosses below the close line. Stop loss strategy is also configured.
Strategy Logic
The strategy uses fast and slow lines of the MACD indicator. The fast line has a parameter of 12-day EMA and the slow line has a parameter of 26-day EMA. The difference between the two lines is the MACD histogram. In addition, 9-day EMA is calculated as the signal line. It goes long when the MACD histogram crosses above 0.04 and closes long positions when crossing below 0.015. Also, 5% stop loss is set.
Specifically, the strategy first calculates the fast line, slow line and signal line of the MACD indicator. Then the long line is set at -0.04, the close line is set at 0.015. If the current MACD histogram is greater than the long line, it goes long. If the current MACD histogram is less than the close line, it closes the long position. In addition, the stop loss line is set at 95% of the entry price.
Advantage Analysis
The strategy has the following advantages:
- Use MACD indicator to judge market trend with high accuracy
- Double filter with long and close lines avoids wrong signals
- Stop loss strategy effectively controls risks
- Simple and clear logic, easy to understand and implement
- Only needs and MACD indicator, less resource occupation
Risk Analysis
The strategy also has some risks:
- MACD indicator has some lagging, may miss short-term opportunities
- Stop loss setting may be too conservative to keep tracking long term trends
- Parameter tuning needs lots of backtesting, otherwise overfitting may occur
- Only applicable to , effectiveness for other pairs is uncertain
Methods like adjusting parameters, combining other indicators can be used to optimize and improve.
Optimization Directions
The strategy can be optimized in the following aspects:
- Test different MACD parameter combinations to find better parameters
Fast line, slow line, signal line with different lengths can be tried to find more suitable combinations
- Try other indicators
Indicators like RSI, KD may have very different results
- Optimize long and close line parameters
More suitable parameters can be found through repetitive backtesting
- Adjust stop loss strategy
Consider trailing stops to make stop loss more dynamic
- Test on different currency pairs
Apply the strategy to other pairs and examine the effects
Conclusion
In conclusion, this is an overall very simple and intuitive long term trading strategy. It judges market conditions using MACD indicator and sets double filter criteria to reduce false trading. Risk control is also configured through stop loss. The logic is clear and resource occupation is low. It is easy to understand and implement, worth recommending. Of course, there is still much room for improvement through parameter tuning, indicator change and other means, to make the strategy even more outstanding.
/*backtest
start: 2024-01-04 00:00:00
end: 2024-01-11 00:00:00
period: 30m
basePeriod: 15m
exchanges: [{"eid":"Futures_Binance","currency":"BTC_USDT"}]
*/

//@version=3
strategy(shorttitle = "GBPJPY MACD", title = "GBPJPY MACD")
fastMA = input(title="Fast moving average",  defval = 12, minval = 7)
slowMA = input(title="Slow moving average",  defval = 26, minval = 7)
lastColor = yellow
[currMacd,_,_] = macd(close[0], fastMA, slowMA, 9)
[prevMacd,_,_] = macd(close[1], fastMA, slowMA, 9)
plotColor = currMacd > 0 ? currMacd > prevMacd ? lime : green : currMacd < prevMacd ? maroon : red
plot(currMacd, style = histogram, color = plotColor, linewidth = 3)
plot(0, title = "Zero line", linewidth = 1, color = gray)

//MACD
// Getting inputs
fast_length = input(title="Fast Length",  defval=12)
slow_length = input(title="Slow Length",  defval=26)
src = input(title="Source",  defval=close)
signal_length = input(title="Signal Smoothing",  minval = 1, maxval = 50, defval =9)
sma_source = input(title="Simple MA(Oscillator)", type=bool, defval=false)
sma_signal = input(title="Simple MA(Signal Line)", type=bool, defval=false)

// Plot colors
col_grow_above = #26A69A
col_grow_below = #FFCDD2
col_fall_above = #B2DFDB
col_fall_below = #EF5350
col_macd = #0094ff
col_signal = #ff6a00

// Calculating
fast_ma = sma_source ? sma(src, fast_length) : ema(src, fast_length)
slow_ma = sma_source ? sma(src, slow_length) : ema(src, slow_length)
macd = fast_ma - slow_ma
signal = sma_signal ? sma(macd, signal_length) : ema(macd, signal_length)
hist = macd - signal

//plot(hist, title="Histogram", style=columns, color=(hist>=0 ? (hist[1] < hist ? col_grow_above : col_fall_above) : (hist[1] < hist ? col_grow_below : col_fall_below) ), transp=0 )
plot(macd, title="MACD", color=col_macd, transp=0)
plot(signal, title="Signal", color=col_signal, transp=0)
///END OF MACD

//Long and Close Long Lines
linebuy = input(title="Enter Long", type=float, defval=-0.04)
linesell = input(title="Close Long", type=float, defval=0.015)

//Plot Long and Close Long Lines
plot(linebuy,color=green),plot(linesell,color=red)


//Stop Loss Input
sl_inp = input(0.05, title='Stop Loss %', type=float)/100


//Order Conditions
longCond = crossover(currMacd, linebuy)
exitLong = crossover(currMacd, linesell)
stop_level = strategy.position_avg_price * (1 - sl_inp)


//Order Entries
strategy.entry("long", strategy.long,  when=longCond==true)
strategy.close("long", when=exitLong==true)
strategy.exit("Stop Loss", stop=stop_level)